March 01, 2026 a 07:31 am
SJM: Dividend Analysis - The J. M. Smucker Company
The J. M. Smucker Company, as a significant player in the consumer sector, presents an intriguing dividend profile characterized by stable payments over decades. Its dividend metrics suggest a reliable income stream, appealing to long-term value investors. Despite recent financial headwinds, its commitment to dividends remains evident, underscoring a robust adherence to shareholder returns.
📊 Overview
The J. M. Smucker Company operates in the consumer goods sector characterized by a solid dividend yield and a long history of uninterrupted dividend payments. The ability to sustain a visible dividend policy over 33 years signifies its commitment to returning capital to shareholders.
| Metric | Details |
|---|---|
| Sector | Consumer |
| Dividend Yield | 3.96% |
| Current Dividend Per Share | 4.28 USD |
| Dividend History | 33 years |
| Last Cut or Suspension | None |
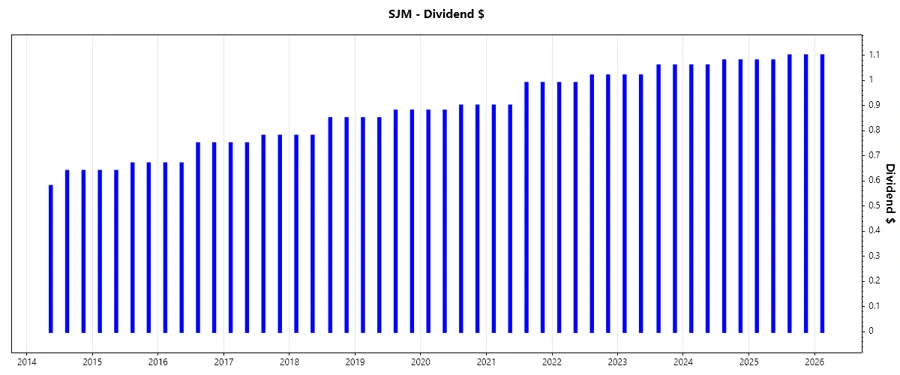
🗣️ Dividend History
The historical consistency of dividend payments, without significant cuts or suspensions, indicates a stable dividend policy that is likely to attract conservative investors. This track record portrays reliability in managing and distributing corporate earnings.
| Year | Dividend Per Share (USD) |
|---|---|
| 2026 | 1.10 |
| 2025 | 4.36 |
| 2024 | 4.28 |
| 2023 | 4.16 |
| 2022 | 4.02 |
📈 Dividend Growth
Dividend growth is a critical indicator of a company's earnings strength and commitment to returning capital to shareholders. Steady growth over the years reflects positively on the company's ability to enhance shareholder value.
| Time | Growth |
|---|---|
| 3 years | 2.74% |
| 5 years | 4.14% |
The average dividend growth is 4.14% over 5 years. This shows moderate but steady dividend growth.
📉 Payout Ratio
The payout ratio informs investors about the sustainability of current dividend levels relative to the company's earnings. Negative values in the EPS payout and a higher FCF-based payout indicate potential concerns over the coverage of dividends by current profits.
| Key Figure | Ratio |
|---|---|
| EPS-based | -36.37% |
| Free cash flow-based | 47.02% |
While the negative EPS-based payout ratio suggests earnings deficiency, the FCF-based ratio shows the dividends are more comfortably covered by available cash flow, showcasing operational stability.
✅ Cashflow & Capital Efficiency
The company's ability to convert earnings into free cash and efficiently utilizing capital is essential for sustaining ongoing operations and future dividends. These metrics reveal how well SJM manages its finances and allocates resources.
| Metric | 2025 | 2024 | 2023 |
|---|---|---|---|
| Free Cash Flow Yield | 6.60% | 5.38% | 4.30% |
| Earnings Yield | -9.95% | 6.22% | -5.47% |
| CAPEX to Operating Cash Flow | 32.53% | 47.71% | 39.65% |
| Stock-based Compensation to Revenue | 0.34% | 0.29% | 0.30% |
| Free Cash Flow / Operating Cash Flow Ratio | 67.47% | 52.29% | 60.35% |
The cash flow data shows a moderate free cash flow yield, signifying modest capital efficiency. The CAPEX to operating cash flow ratio points to a considerable reinvestment level, while stable stock-based compensation maintains equity dilution at a minimum.
⚠️ Balance Sheet & Leverage Analysis
Analyzing leverage ratios and comparing debt levels against assets and equity provides insights into a company's financial structure and risk exposure related to interest rate impacts and financial solvency.
| Metric | 2025 | 2024 | 2023 |
|---|---|---|---|
| Debt-to-Equity | 1.28 | 1.11 | 0.61 |
| Debt-to-Assets | 44.19% | 42.16% | 29.51% |
| Debt-to-Capital | 56.06% | 52.63% | 37.77% |
| Net Debt to EBITDA | -49.43 | 5.02 | 6.57 |
| Current Ratio | 0.81 | 0.52 | 1.44 |
| Quick Ratio | 0.35 | 0.25 | 0.93 |
| Financial Leverage | 2.89 | 2.64 | 2.06 |
The upward trend in debt levels compared to both equity and assets suggests a growing reliance on borrowed funds, raising financial risk. However, an improved current ratio in 2023 signals better liquidity positioning.
🔍 Fundamental Strength & Profitability
Profitability metrics, alongside efficiency ratios such as ROI and margins, offer a comprehensive view of a company's financial health and ability to generate returns from investments.
| Metric | 2025 | 2024 | 2023 |
|---|---|---|---|
| Return on Equity | -20.23% | 9.67% | -1.25% |
| Return on Assets | -7.01% | 3.67% | -0.61% |
| Return on Invested Capital | -4.33% | 5.37% | 1.21% |
| Margins - Net | -14.10% | 9.10% | -1.07% |
| EBIT Margin | -7.54% | 15.41% | 1.67% |
| EBITDA Margin | -1.78% | 20.68% | 6.73% |
| Gross Margin | 38.79% | 38.09% | 32.85% |
| Research & Development to Revenue | 0.00% | 0.00% | 0.00% |
The fluctuating margin and profitability ratios highlight operational volatility, reducing the predictability of future returns. Nevertheless, a consistently high gross margin reflects strong pricing power in the market.
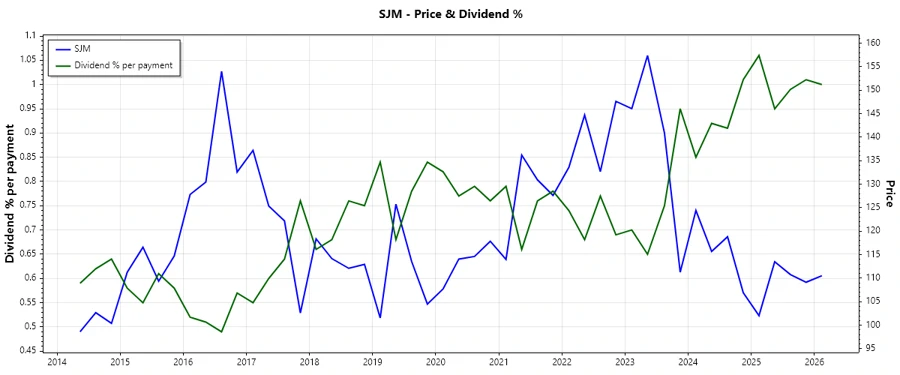
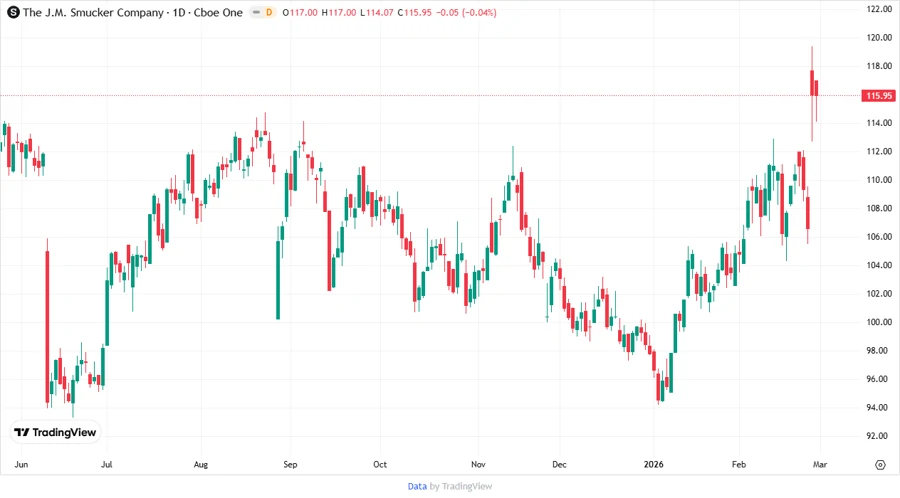
🔎 Price Development
📏 Dividend Scoring System
| Criteria | Score | Indicator |
|---|---|---|
| Dividend Yield | 4 | |
| Dividend Stability | 5 | |
| Dividend Growth | 3 | |
| Payout Ratio | 2 | |
| Financial Stability | 3 | |
| Dividend Continuity | 5 | |
| Cashflow Coverage | 3 | |
| Balance Sheet Quality | 3 |
Total Score: 28 out of 40 points
🔍 Rating
In conclusion, while The J. M. Smucker Company showcases a stable dividend history and consistent returns, recent indicators of financial volatility call for a cautious stance. Recommended for investors prioritizing stable income but weighing risks of fluctuating returns and financial instability.
Smart Data Insight
Master the Perfect Entry & Exit for this Stock
Don't leave your profits to chance. Historically, this stock follows specific seasonal patterns that institutional traders use to maximize returns.
- ✅ Identify the "Golden Buying Window"
- ✅ Avoid high-risk correction cycles
- ✅ Backtested data from the last 20+ years