February 02, 2026 a 03:31 am

SJM: Dividend Analysis - The J. M. Smucker Company
The J. M. Smucker Company continues to uphold its reputation as a reliable dividend payer in the consumer staples sector. With over three decades of consistent and uninterrupted dividend payouts, the company demonstrates resilience even in challenging economic conditions. Despite its negative EPS payout ratio due to recent financial challenges, its strong dividend history remains a testament to its commitment to shareholder returns.
Overview 📊
The J. M. Smucker Company, a veteran in the consumer staples sector, currently provides a dividend yield of 4.18%, backed by a current dividend per share of $4.28. With 33 years of dividend history, it stands as a stalwart in dividend reliability. The last dividend cut or suspension remains unrecorded, showcasing stable dividend disbursements.
| Metric | Value |
|---|---|
| Sector | Consumer Staples |
| Dividend Yield | 4.18% |
| Current Dividend per Share | 4.28 USD |
| Dividend History | 33 years |
| Last Cut or Suspension | None |
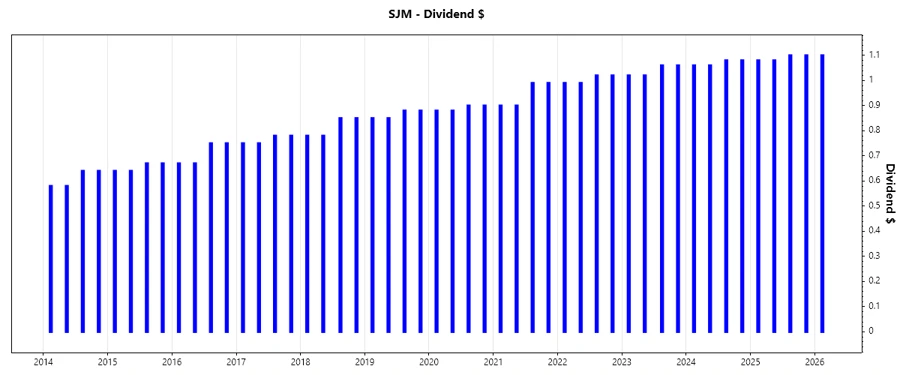
Dividend History 🗣️
Analyzing dividend history provides insights into a company’s commitment to returning value to shareholders. A track record of consistent dividends reflects robust cash flow management and stability.
| Year | Dividend per Share (USD) |
|---|---|
| 2025 | 4.36 |
| 2024 | 4.28 |
| 2023 | 4.16 |
| 2022 | 4.02 |
| 2021 | 3.78 |
Dividend Growth 📈
The growth of dividends is pivotal for assessing potential long-term value. While the 3-year growth of 2.74% suggests caution, the 5-year growth average of 4.14% indicates moderate but steady expansion.
| Time | Growth |
|---|---|
| 3 years | 2.74% |
| 5 years | 4.14% |
The average dividend growth is 4.14% over 5 years. This shows moderate but steady dividend growth.
Payout Ratio 📉
Payout ratios provide a direct look at how much of the earnings or free cash flow is returned to shareholders. This can indicate the sustainability of dividend payments.
| Key figure | Ratio |
|---|---|
| EPS-based | -38.22% |
| Free cash flow-based | 71.86% |
Given a negative EPS-based payout ratio but a reasonable 71.86% FCF-based ratio, there are profitability concerns, yet the company seems capable of maintaining dividends through effective cash flow optimization.
Cashflow & Capital Efficiency
Understanding cash flow dynamics and capital efficiency is crucial to evaluate the operational effectiveness and resource allocation of a company.
| Year | 2025 | 2024 | 2023 |
|---|---|---|---|
| Free Cash Flow Yield | 6.60% | 5.38% | 4.30% |
| Earnings Yield | -9.95% | 6.23% | -0.55% |
| CAPEX to Operating Cash Flow | 32.53% | 47.71% | 39.65% |
| Stock-based Compensation to Revenue | 0.34% | 0.29% | 0.30% |
| Free Cash Flow / Operating Cash Flow Ratio | 67.47% | 52.29% | 60.35% |
Despite negative earnings yield and rising CAPEX, the consistent free cash flow yield signifies solid capital efficiency, crucial for sustaining dividends.
Balance Sheet & Leverage Analysis
Analyzing leverage and balance sheet health provides insights into the company’s long-term financial stability and liquidity.
| Year | 2025 | 2024 | 2023 |
|---|---|---|---|
| Debt-to-Equity | 127.60% | 111.10% | 60.69% |
| Debt-to-Assets | 44.19% | 42.16% | 29.51% |
| Debt-to-Capital | 56.06% | 52.63% | 37.77% |
| Net Debt to EBITDA | -49.43 | 5.02 | 6.57 |
| Current Ratio | 0.88 | 0.52 | 1.44 |
| Quick Ratio | 0.35 | 0.25 | 0.93 |
| Financial Leverage | 2.89 | 2.63 | 2.06 |
Although leverage ratios are high, the decrease in financial leverage aligns with efforts to manage debt sustainably, ensuring financial flexibility.
Fundamental Strength & Profitability
Reviewing fundamental strength and profitability is essential to determine the long-term viability and operational performance.
| Year | 2025 | 2024 | 2023 |
|---|---|---|---|
| Return on Equity | -20.23% | 9.67% | -1.25% |
| Return on Assets | -7.01% | 3.67% | -0.61% |
| Return on Invested Capital | -4.33% | 5.37% | 1.21% |
| Margins: Net | -14.10% | 9.10% | -1.07% |
| Margins: EBIT | -7.54% | 15.41% | 1.67% |
| Margins: EBITDA | -1.78% | 20.68% | 6.73% |
| Margins: Gross | 38.79% | 38.09% | 32.85% |
| R&D to Revenue | 0% | 0% | 0% |
While recent profitability challenges raise concerns, consistent gross margins underscore the potential for operational recovery with strategic initiatives.
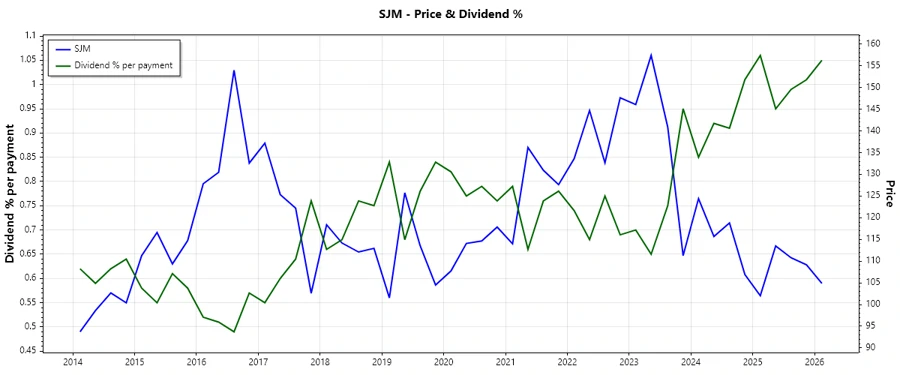
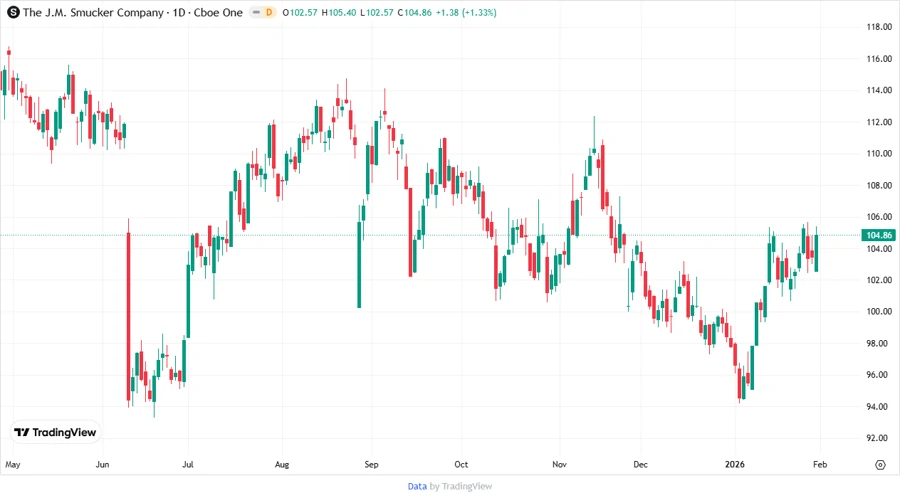
Price Development 📈
Dividend Scoring System ⚠️
| Category | Score | Score Bar |
|---|---|---|
| Dividend Yield | 4 | |
| Dividend Stability | 5 | |
| Dividend Growth | 3 | |
| Payout Ratio | 2 | |
| Financial Stability | 3 | |
| Dividend Continuity | 4 | |
| Cashflow Coverage | 3 | |
| Balance Sheet Quality | 2 |
Overall Score: 26/40
Rating ✅
The J. M. Smucker Company showcases itself as a credible dividend payer with a noteworthy track record of resilience amidst economic shifts. While faced with recent profitability issues, the company's dividend reliability and strategic initiatives make it a contender for dividend-focused portfolios. Continued monitoring of its financial recovery is advised.
Smart Data Insight
Master the Perfect Entry & Exit for this Stock
Don't leave your profits to chance. Historically, this stock follows specific seasonal patterns that institutional traders use to maximize returns.
- ✅ Identify the "Golden Buying Window"
- ✅ Avoid high-risk correction cycles
- ✅ Backtested data from the last 20+ years