December 07, 2025 a 03:31 pm


SJM: Dividend Analysis - The J. M. Smucker Company
The J. M. Smucker Company showcases a blend of stability and moderate growth through its robust dividend profile. With a commendable 32-year history of consistent dividend payments, it offers a solid return to shareholders. However, the recent financial metrics could raise concerns about its operational resilience and financial structure. Nevertheless, its steady dividend yield continues to attract income-focused investors.
📊 Overview
The J. M. Smucker Company's dividend profile presents both opportunities and challenges. Featuring a dividend yield of 3.99% and an uninterrupted history of 32 years, it appeals to long-term investors seeking reliability. However, its last dividend cut in 2009 remains a cautionary note.
| Metric | Details |
|---|---|
| Sector | Consumer Staples |
| Dividend Yield | 3.99% |
| Current Dividend per Share | 4.28 USD |
| Dividend History | 32 years |
| Last Cut or Suspension | 2009 |
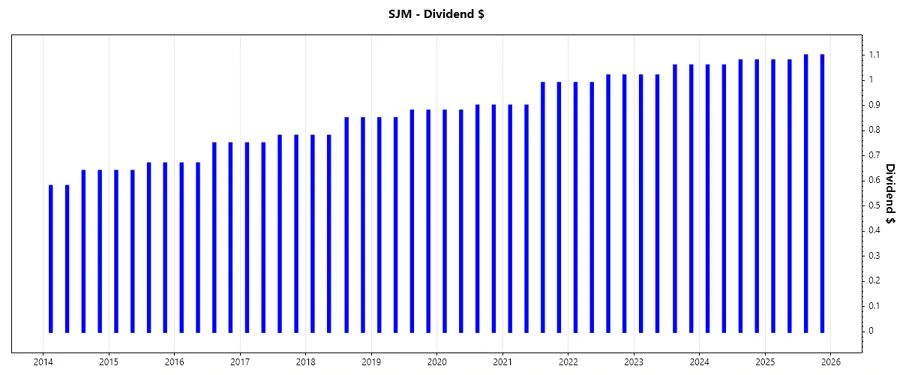
📈 Dividend History
Consistent dividend payouts illustrate a company's strength in returning profits to shareholders. J. M. Smucker's 32-year history signals the company's commitment to its investor base.
| Year | Dividend per Share (USD) |
|---|---|
| 2025 | 4.36 |
| 2024 | 4.28 |
| 2023 | 4.16 |
| 2022 | 4.02 |
| 2021 | 3.78 |
📈 Dividend Growth
Dividend growth is critical for assessing the sustainability and potential future increase in dividends, reflecting the company's profitability growth over time.
| Time | Growth |
|---|---|
| 3 years | 4.23% |
| 5 years | 4.35% |
The average dividend growth is 4.35% over 5 years. This shows moderate but steady dividend growth.
✅ Payout Ratio
Analyzing the payout ratio helps identify how well earnings support dividend payments, hinting at future dividend sustainability.
| Key Figure | Ratio |
|---|---|
| EPS-based | -38.22% |
| Free Cash Flow-based | 71.86% |
The EPS-based ratio of -38.22% suggests that earnings are currently insufficient to cover dividends, relying mainly on cash flow for payouts.
Cashflow & Capital Efficiency
These metrics highlight the company's ability to generate and efficiently use cash, ensuring sustainable operations and dividends.
| Year | 2023 | 2024 | 2025 |
|---|---|---|---|
| Free Cash Flow Yield | 4.30% | 5.38% | 6.60% |
| Earnings Yield | -0.55% | 6.22% | -9.95% |
| CAPEX to Operating Cash Flow | 39.65% | 47.71% | 32.53% |
| Stock-based Compensation to Revenue | 0.30% | 0.29% | 0.34% |
| Free Cash Flow / Operating Cash Flow Ratio | 60.35% | 52.29% | 67.47% |
The company shows strong cash flow generation and capital management, though earnings yield volatility raises questions about consistent profitability.
Balance Sheet & Leverage Analysis
This analysis provides insights into the company's financial stability and its foundation to withstand economic fluctuations through leveraged balance sheets.
| Year | 2023 | 2024 | 2025 |
|---|---|---|---|
| Debt-to-Equity | 60.69% | 111.10% | 127.60% |
| Debt-to-Assets | 29.51% | 42.16% | 44.19% |
| Net Debt to EBITDA | 656.81% | 501.69% | 494.33% |
| Current Ratio | 1.44 | 0.52 | 0.81 |
| Quick Ratio | 0.93 | 0.25 | 0.35 |
Although leverage is significantly high, the current and quick ratios show mixed liquidity management capabilities, raising some solvency concerns.
Fundamental Strength & Profitability
These metrics measure the company's efficiency in generating profits relative to its revenue and operational costs, critical for long-term shareholder value.
| Year | 2023 | 2024 | 2025 |
|---|---|---|---|
| Return on Equity | -1.25% | 9.67% | -20.23% |
| Return on Assets | -0.61% | 3.67% | -7.01% |
| Net Margin | -1.07% | 9.10% | -14.10% |
| EBIT Margin | 1.67% | 15.41% | -7.54% |
The decline in margins and negative returns on equity and assets highlight profitability challenges that may impact future growth.
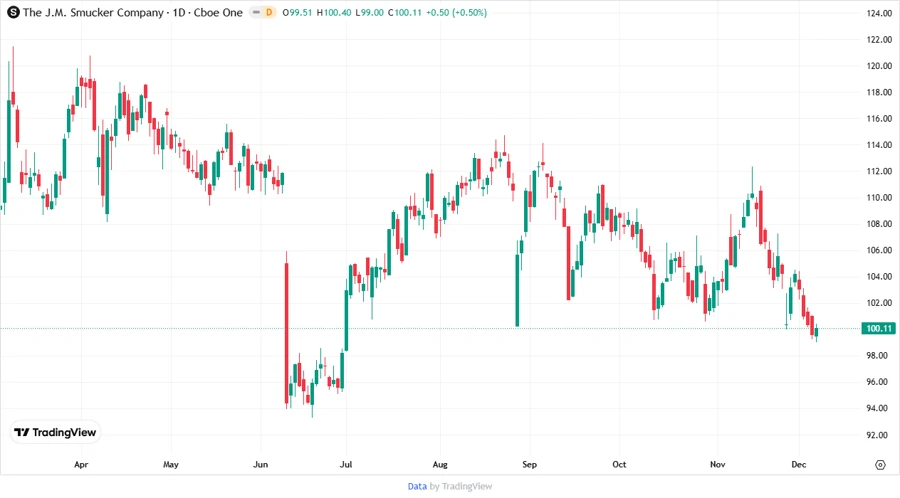
Price Development
🗣️ Dividend Scoring System
| Criteria | Score | Score Bar |
|---|---|---|
| Dividend Yield | 4 | |
| Dividend Stability | 5 | |
| Dividend Growth | 3 | |
| Payout Ratio | 2 | |
| Financial Stability | 2 | |
| Dividend Continuity | 5 | |
| Cashflow Coverage | 4 | |
| Balance Sheet Quality | 3 |
Overall Score: 28/40
Rating
The J. M. Smucker Company offers a reliable dividend profile with a moderate overall attractiveness for dividend-focused investors. While its steady dividend history and yield are significant positives, the negative returns and leverage challenges suggest caution. As such, the stock is suitable for investors seeking stable income, balanced by a careful watch on financial metrics.