August 18, 2025 a 03:32 am

SJM: Dividend Analysis - The J. M. Smucker Company
The J. M. Smucker Company (SJM) holds a respectable position within the consumer staples sector, particularly known for its consistent dividend payout history over 32 years. Despite recent volatility in financial ratios and earnings, its stable dividend yield of 3.92% suggests continued investor interest in the company. Key challenges lie in aligning profitability with capital efficiency, alongside maintaining dividend growth amidst fluctuating financials.
📊 Overview
In-depth analysis of SJM's dividend metrics indicates a stable positioning within the sector, accompanied by moderate dividend yield.
| Metric | Value |
|---|---|
| Sector | Consumer Staples |
| Dividend yield | 3.92% |
| Current dividend per share | 4.28 USD |
| Dividend history | 32 years |
| Last cut or suspension | None |
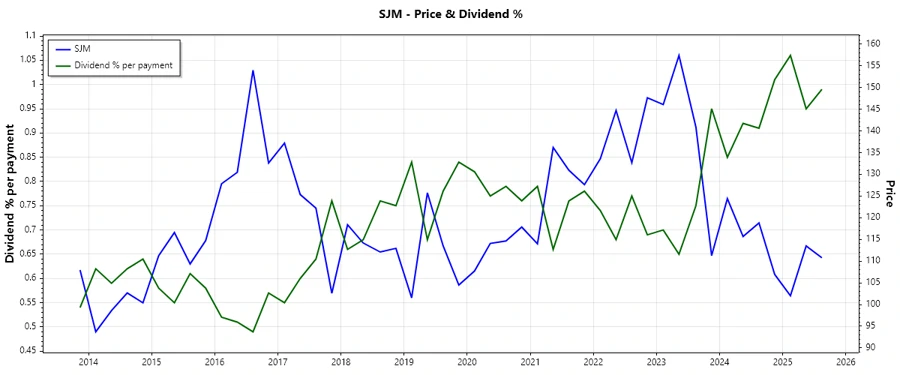
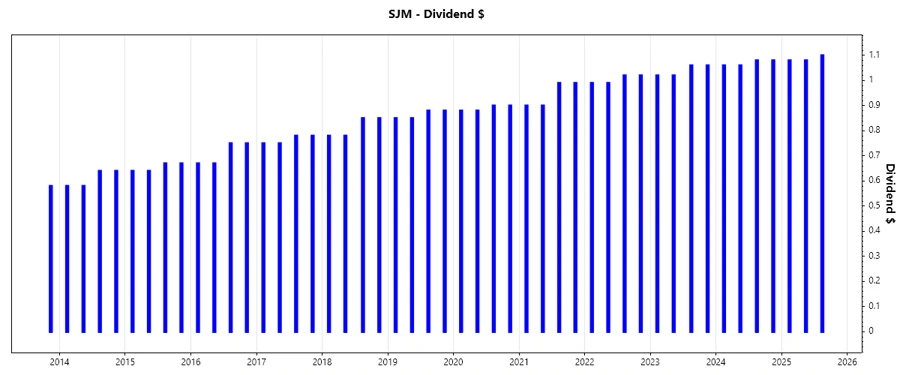
📉 Dividend History
SJM's dividend history is a testament to the company's commitment to returning value to shareholders. Maintaining a 32-year streak without cuts is a strong indicator of stability. Such consistency supports investor confidence and enhances stock attractiveness, ideal for long-term dividend growth strategies.
This chart illustrates the historical dividend payments of The J. M. Smucker Company.
| Year | Dividend per Share (USD) |
|---|---|
| 2025 | 3.26 |
| 2024 | 4.28 |
| 2023 | 4.16 |
| 2022 | 4.02 |
| 2021 | 3.78 |
📈 Dividend Growth
Examining dividend growth rates over short and mid-term periods reveals the company's strategy to enhance shareholder returns progressively. Even amidst volatile earnings, a steady growth can anchor investor expectations and encourage enduring investment.
| Time | Growth |
|---|---|
| 3 years | 4.23% |
| 5 years | 4.35% |
The average dividend growth is 4.35% over 5 years. This shows moderate but steady dividend growth.
This chart highlights the dividend growth over a 5-year period.
✅ Payout Ratio
Payout ratios give insight into the company's ability to distribute dividends from its earnings and cash flow. A balanced ratio ensures sustainable dividend payments without compromising financial health.
| Key figure | Ratio |
|---|---|
| EPS-based | -37.00% |
| Free cash flow-based | 55.92% |
The EPS-based payout ratio reflects a period of negative earnings, indicating reliance on cash flow for dividends. Conversely, the FCF-based ratio shows a healthier, sustainable yield, suggesting dividends are well-covered by operational cash flow.
💰 Cashflow & Capital Efficiency
Evaluating cash flow dynamics and capital efficiency is pivotal for assessing intrinsic value and operational viability, providing foresight into potential growth or risk zones.
| Metric | 2023 | 2024 | 2025 |
|---|---|---|---|
| Free Cash Flow Yield | 4.30% | 5.38% | 6.60% |
| Earnings Yield | -0.55% | 6.22% | -9.95% |
| CAPEX to Operating Cash Flow | 39.65% | 47.71% | 32.53% |
| Stock-based Compensation to Revenue | 0.30% | 0.29% | 0.34% |
| Free Cash Flow / Operating Cash Flow Ratio | 60.35% | 52.29% | 67.47% |
Despite pressures on earnings, robust free cash flow reflects underlying financial resilience, crucial for sustaining productive growth. Efficient capital allocation is paramount amidst evolving market conditions.
🔍 Balance Sheet & Leverage Analysis
Analyzing balance sheet credentials uncovers liquidity, leverage positioning, and overall financial stability, essential in ascertaining a firm’s long-term risk profile.
| Metric | 2023 | 2024 | 2025 |
|---|---|---|---|
| Debt-to-Equity | 0.61 | 1.11 | 1.28 |
| Debt-to-Assets | 0.30 | 0.42 | 0.44 |
| Debt-to-Capital | 0.38 | 0.53 | 0.56 |
| Net Debt to EBITDA | 6.57 | 5.02 | 49.43 |
| Current Ratio | 1.44 | 0.52 | 0.81 |
| Quick Ratio | 0.93 | 0.25 | 0.35 |
| Financial Leverage | 2.06 | 2.64 | 2.89 |
The leverage profile suggests a high debt burden, with an uptick in ratios highlighting increased financial obligations. Maintaining operational liquidity is crucial to manage these liabilities effectively.
🏢 Fundamental Strength & Profitability
Fundamental measures highlight operational efficiency, profitability margins, and strategic thrust into research initiatives dictating competitive leverage.
| Metric | 2023 | 2024 | 2025 |
|---|---|---|---|
| Return on Equity | -1.25% | 9.67% | -20.23% |
| Return on Assets | -0.61% | 3.67% | -7.01% |
| Net Profit Margin | -1.07% | 9.10% | -14.10% |
| Gross Margin | 32.85% | 38.09% | 38.79% |
| EBIT Margin | 1.67% | 15.41% | -7.54% |
| EBITDA Margin | 6.73% | 20.68% | -1.78% |
| R&D to Revenue | 0% | 0% | 0% |
The financial health of the firm indicates strains, evidenced by negative returns and fluctuating profitability metrics. Strengthening revenue-generating capabilities is essential for enduring economic sustainability.
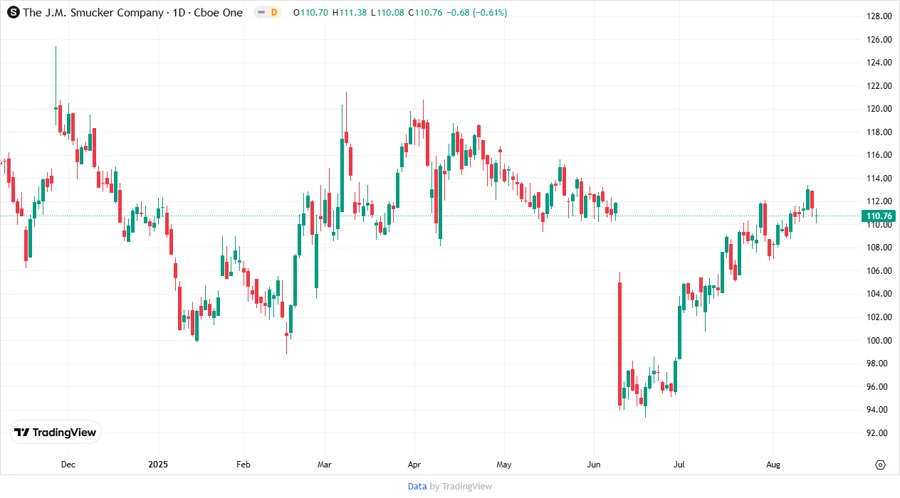
💹 Price Development
This chart represents the recent price development of The J. M. Smucker Company.
📊 Dividend Scoring System
Utilizing a comprehensive scoring system to evaluate J. M. Smucker's strategic dividend positioning and financial health:
| Category | Score (Out of 5) | Rating Bar |
|---|---|---|
| Dividend yield | 4 | |
| Dividend Stability | 5 | |
| Dividend growth | 4 | |
| Payout ratio | 2 | |
| Financial stability | 2 | |
| Dividend continuity | 5 | |
| Cashflow Coverage | 3 | |
| Balance Sheet Quality | 3 |
Overall Score: 28/40
🗣️ Rating
The J. M. Smucker Company demonstrates a solid dividend payout lineage and a credible growth trajectory. However, areas of concern lie in its current leverage situation and negative profitability metrics. Potential investors should weigh these elements whilst considering the company's consistent dividend offerings and sectorial position.
Smart Data Insight
Master the Perfect Entry & Exit for this Stock
Don't leave your profits to chance. Historically, this stock follows specific seasonal patterns that institutional traders use to maximize returns.
- ✅ Identify the "Golden Buying Window"
- ✅ Avoid high-risk correction cycles
- ✅ Backtested data from the last 20+ years