June 10, 2026 a 08:15 am

SHW: Trend and Support & Resistance Analysis - The Sherwin-Williams Company
The Sherwin-Williams Company (SHW), a key player in paints and coatings, has shown notable price action recently. Analyzing the stock’s trend and key support/resistance levels provides insights for future movement. Evaluating the moving averages and identifying zones could help traders make informed decisions in anticipation of upcoming market moves.
Trend Analysis
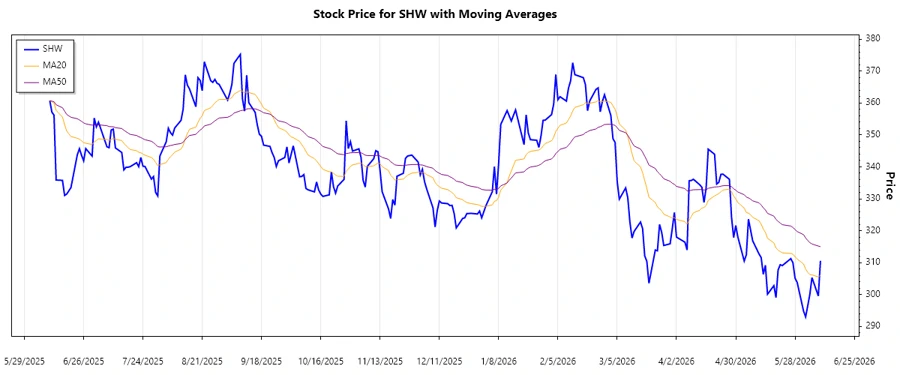
The stock price of The Sherwin-Williams Company has displayed fluctuating behavior over the last few months. Calculating the Exponential Moving Averages (EMA), we find that the current EMA20 is below EMA50, indicating a ▼ Abwärtstrend. This suggests a potential continuation of the bearish movement unless market circumstances change.
| Datum | Schlusskurs | Trend |
|---|---|---|
| 2026-06-09 | 310.55 | ⬇️ |
| 2026-06-08 | 299.55 | ⬇️ |
| 2026-06-05 | 305.3 | ⬇️ |
| 2026-06-04 | 300.09 | ⬇️ |
| 2026-06-03 | 296.49 | ⬇️ |
| 2026-06-02 | 293 | ⬇️ |
| 2026-06-01 | 294.86 | ⬇️ |
This sustained downtrend indicates bearish momentum, advising caution for potential buyers in the short term.
Support and Resistance
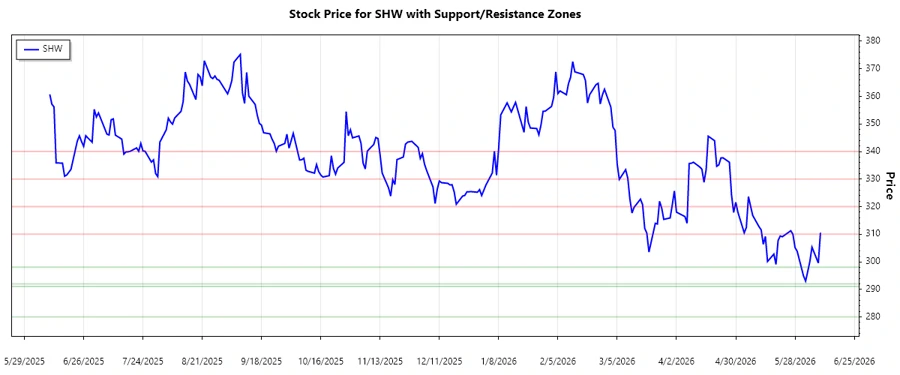
Analysis of recent price levels identifies the following key support and resistance zones that could influence future stock movements:
| Zone Type | Price From | Price To | |
|---|---|---|---|
| Support Zone 1 | 292 | 298 | ⬇️ |
| Support Zone 2 | 280 | 291 | ⬇️ |
| Resistance Zone 1 | 310 | 320 | ⬆️ |
| Resistance Zone 2 | 330 | 340 | ⬆️ |
The current price around 310.55 is close to the lower support zone, suggesting potential for a rebound or further decline if this level breaks.
Conclusion
As Sherwin-Williams continues to navigate the complex landscape of the global paint and coatings market, current technical indicators suggest a prevailing bearish trend. Analysts should consider the potential downside risks associated with the stock's proximity to support levels. Nevertheless, should the stock break through recent resistance levels, opportunities for bullish positions could arise. Understanding these dynamics in technical context is vital for making informed investment decisions in the paints and coatings sector.
Smart Data Insight
Master the Perfect Entry & Exit for this Stock
Don't leave your profits to chance. Historically, this stock follows specific seasonal patterns that institutional traders use to maximize returns.
- ✅ Identify the "Golden Buying Window"
- ✅ Avoid high-risk correction cycles
- ✅ Backtested data from the last 20+ years