October 10, 2025 a 09:03 am
SHW: Trend and Support & Resistance Analysis - The Sherwin-Williams Company
The Sherwin-Williams Company, a leading paint and coatings manufacturer, has shown noteworthy fluctuations in recent months. An initial analysis based on the available data suggests potential changes in market momentum. Investors should pay close attention to forthcoming patterns and zones for guidance on potential trade opportunities.
Trend Analysis
| Date | Closing Price | Trend |
|---|---|---|
| 2025-10-09 | $333.22 | ▼ |
| 2025-10-08 | $337.57 | ▼ |
| 2025-10-07 | $337.00 | ▼ |
| 2025-10-06 | $336.91 | ▼ |
| 2025-10-03 | $346.60 | ▲ |
| 2025-10-02 | $343.90 | ▲ |
| 2025-10-01 | $341.22 | ▲ |
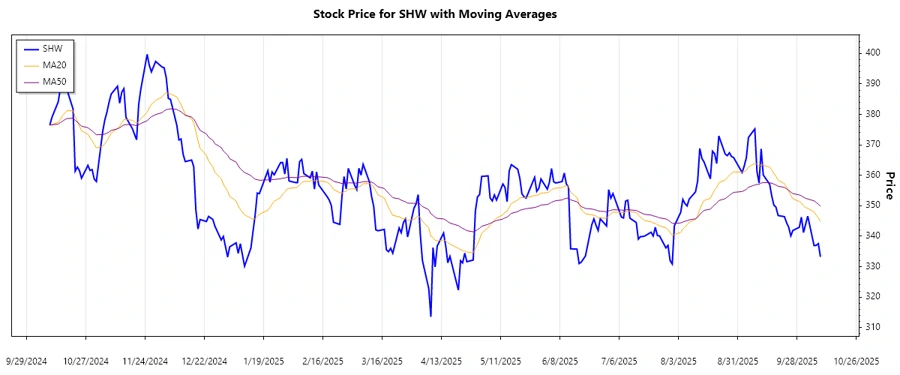
The current trend indicates a recent short-term downward movement following a period of stabilization, as suggested by the EMA calculations over the previous weeks. This signals potential selling pressure which investors should monitor closely. Based on EMA20 and EMA50, we currently observe a ▼ downtrend.
Support- and Resistance
| Zone | From | To |
|---|---|---|
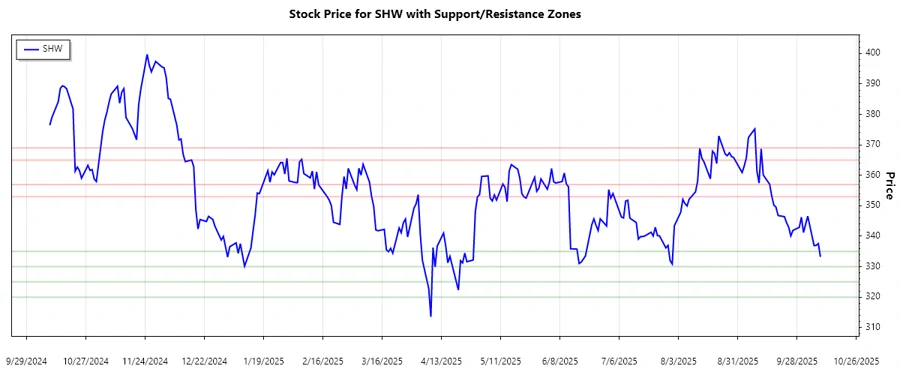
| Resistance 1 | $353.00 | $357.00 |
| Resistance 2 | $365.00 | $369.00 |
| Support 1 | $330.00 | $335.00 |
| Support 2 | $320.00 | $325.00 |
Currently, the stock price is within the Support Zone 1, which may provide a buffer against further declines. Investors should watch this level closely for potential breaks or reversals. Overall, the support levels may hold strong unless there's increased downward momentum.
Conclusion
The Sherwin-Williams Company's stock demonstrates a current short-term downtrend, with distinct support and resistance zones based on the latest data. While the stock is testing support levels, traders should remain vigilant for possible breakouts. The intersection of these zones with broader market trends and financial health could signal future trade opportunities. Overall, prudent consideration of both technical and fundamental analyses is crucial for making well-informed decisions regarding this asset.
Smart Data Insight
Master the Perfect Entry & Exit for this Stock
Don't leave your profits to chance. Historically, this stock follows specific seasonal patterns that institutional traders use to maximize returns.
- ✅ Identify the "Golden Buying Window"
- ✅ Avoid high-risk correction cycles
- ✅ Backtested data from the last 20+ years