September 05, 2025 a 03:15 am
SHW: Trend and Support & Resistance Analysis - The Sherwin-Williams Company
The Sherwin-Williams Company, a leader in the paint and coatings industry, presents a dynamic blend of opportunities and challenges in the stock market. Considering its extensive global operations, the stock's performance is influenced by market demand, raw material costs, and competitive pressures. Recent technical analysis indicates fluctuating trends, necessitating keen investor insight for strategic positioning.
Trend Analysis
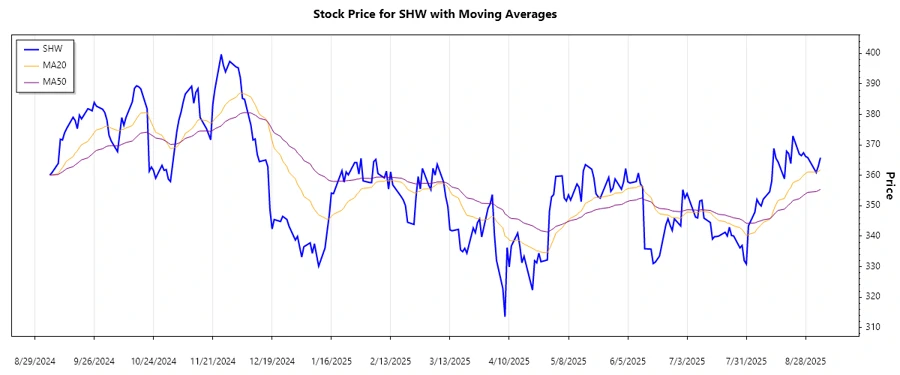
The recent analysis of SHW stock indicates various phases in its performance. Calculating the Exponential Moving Averages (EMA) for 20 and 50 days highlights the predominant market trend:
| Date | Closing Price | Trend |
|---|---|---|
| 2025-09-04 | $365.78 | ▲ Uptrend |
| 2025-09-03 | $363.03 | ▲ Uptrend |
| 2025-09-02 | $360.92 | ▲ Uptrend |
| 2025-08-29 | $365.83 | ▲ Uptrend |
| 2025-08-28 | $366.18 | ▲ Uptrend |
| 2025-08-27 | $367.40 | ▲ Uptrend |
| 2025-08-26 | $366.46 | ▲ Uptrend |
The chart demonstrates a consistent upward movement, indicative of positive market sentiment. The EMA calculations reinforce a strong uptrend, potentially signaling continued growth.
Support and Resistance
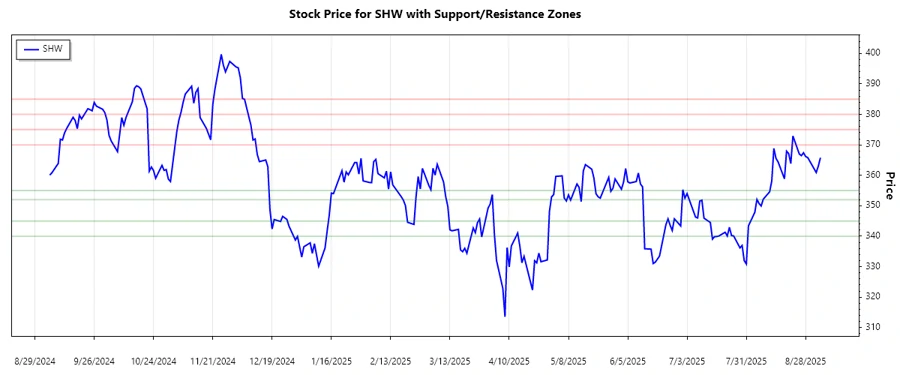
Analyzing support and resistance zones helps determine market strength and potential reversal points:
| Zone Type | Price Range | Direction |
|---|---|---|
| Support 1 | $352.00 - $355.00 | ⬆ Stable |
| Support 2 | $340.00 - $345.00 | ⬆ Stable |
| Resistance 1 | $370.00 - $375.00 | ⬇ Weak |
| Resistance 2 | $380.00 - $385.00 | ⬇ Weak |
The current price is near the Resistance 1 zone, indicating potential resistance. Moving past this may confirm the uptrend, but caution is advised.
Conclusion
In summary, The Sherwin-Williams Company's stock demonstrates promising growth with potential for further upside. However, resistance levels may challenge continued ascension. Investors should monitor raw material cost trends and competitive market shifts. A solid understanding of technical indicators and market conditions will be essential to developing informed investment strategies in this dynamic sector.
Smart Data Insight
Master the Perfect Entry & Exit for this Stock
Don't leave your profits to chance. Historically, this stock follows specific seasonal patterns that institutional traders use to maximize returns.
- ✅ Identify the "Golden Buying Window"
- ✅ Avoid high-risk correction cycles
- ✅ Backtested data from the last 20+ years