April 27, 2026 a 05:15 am

SHW: Fibonacci Analysis - The Sherwin-Williams Company
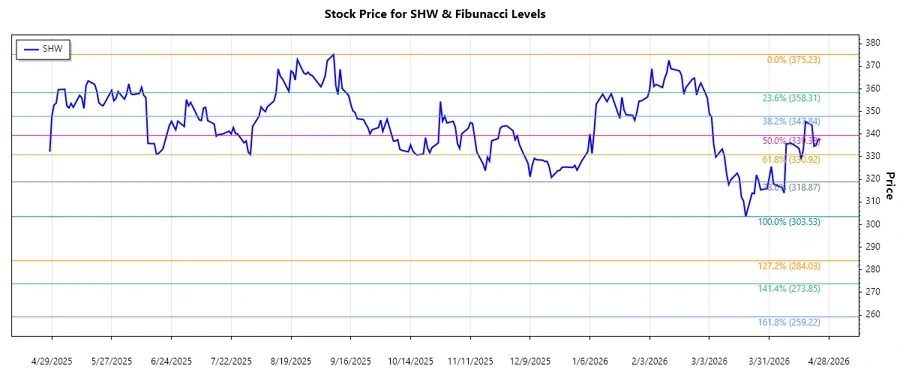
The Sherwin-Williams Company's recent market behavior offers substantial insights for analysts and investors alike. Facing a dominant downward trend, understanding price action becomes crucial. Currently, Sherwin-Williams is navigating challenging market dynamics, deeply influenced by wider economic conditions and sector-specific demand. The technical analysis of recent trends reveals potential retracement levels, which could inform strategic positioning.
Fibonacci Analysis
| Information | Details |
|---|---|
| Start Date | 2025-09-08 |
| End Date | 2026-04-24 |
| High Point | $375.23 (2025-09-08) |
| Low Point | $303.53 (2026-03-20) |
| Current Price | $337.7 |
| Fibonacci Levels |
|
| Retracement Zone | 0.382 |
| Interpretation | The current price is within the 0.382 retracement zone, indicating a potential resistance level. This zone may reflect short-term price consolidation. |
Conclusion
The analysis highlights Sherwin-Williams' recent downward trend within the observed timeframe, marked by significant price fluctuations. This analysis underscores potential resistance at current levels, presenting short-term trading opportunities and long-term strategic positioning challenges. The 0.382 Fibonacci retracement level could act as a resistance, influencing future movements. Investors should remain cautious, as broader economic impacts and industry shifts continue to affect stock performance. While technical levels offer speculative opportunities, external macroeconomic factors may drive definitive price trends.