
July 15, 2026 a 12:46 pm
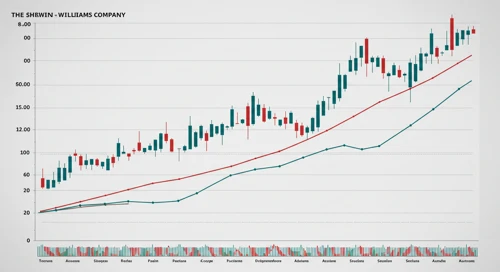


SHW: Dividend Analysis - The Sherwin-Williams Company
As a leader in the paints and coatings industry, The Sherwin-Williams Company has maintained a strong position through strategic growth and consistent shareholder returns. The company's impressive 42 years of dividend history demonstrates both stability and commitment to shareholder value. However, the modest dividend yield and relatively high debt levels warrant cautious optimism.
📊 Overview
The Sherwin-Williams Company operates in the industrial sector, focusing on manufacturing and distributing high-quality paints and coatings. The company's dividend yield stands at 1.03%, with a current dividend per share of 3.21 USD. Impressively, the firm has maintained its dividend payments for 42 years, showcasing robust financial health and a commitment to shareholder returns.
| Metric | Value |
|---|---|
| Sector | Industrial |
| Dividend yield | 1.03% |
| Current dividend per share | 3.21 USD |
| Dividend history | 42 years |
| Last cut or suspension | None |
📈 Dividend History
The legacy of consistent dividend payments reflects a company's commitment to sharing profits with its investors. Sherwin-Williams' 42-year streak without cuts is a testament to its financial stability and strategic growth execution.
| Year | Dividend per Share (USD) |
|---|---|
| 2026 | 1.60 |
| 2025 | 3.16 |
| 2024 | 2.86 |
| 2023 | 2.42 |
| 2022 | 2.40 |
📊 Dividend Growth
Dividend growth rates are crucial for assessing a company's potential to increase payouts, thus benefiting investors' future yield. Sherwin-Williams has exhibited modest dividend growth in recent years.
| Time | Growth |
|---|---|
| 3 years | 9.60% |
| 5 years | 12.08% |
The average dividend growth is 12.08% over 5 years. This shows moderate but steady dividend growth.
📉 Payout Ratio
Payout ratios help determine the sustainability of a company's dividends. Sherwin-Williams exhibits efficient dividend management with an EPS-based payout ratio of 30.30% and an FCF-based payout ratio of 27.21%, indicating a balanced approach towards reinvestment and dividend distribution.
| Key figure | Ratio |
|---|---|
| EPS-based | 30.30% |
| Free cash flow-based | 27.21% |
These ratios suggest that the dividends are currently sustainable, leaving room for future growth and reinvestment in the business.
✅ Cashflow & Capital Efficiency
Monitoring cash flow stability and capital efficiency is vital for understanding a firm's operational performance and potential to honor dividend commitments. Sherwin-Williams demonstrates healthy ratios, showcasing its capability to manage operational cash effectively.
| Metrics | 2023 | 2024 | 2025 |
|---|---|---|---|
| Free Cash Flow Yield | 3.31% | 2.41% | 3.32% |
| Earnings Yield | 3.00% | 3.10% | 3.22% |
| CAPEX to Operating Cash Flow | 25.23% | 33.93% | 23.11% |
| Stock-based Compensation to Revenue | 0.50% | 0.60% | 0.52% |
| Free Cash Flow / Operating Cash Flow Ratio | 74.77% | 66.07% | 76.89% |
The cash flow metrics indicate strong management efficiency, supporting steady operations and further reinforcing dividend sustainability.
⚠️ Balance Sheet & Leverage Analysis
Assessing leverage and liquidity gives clarity on a company's financial stability. While the high debt ratios raise caution, Sherwin-Williams' balance sheet strength reflects its robust financial underpinnings.
| Metrics | 2023 | 2024 | 2025 |
|---|---|---|---|
| Debt-to-Equity | 3.18 | 2.94 | 3.16 |
| Debt-to-Assets | 0.51 | 0.50 | 0.56 |
| Debt-to-Capital | 0.76 | 0.75 | 0.76 |
| Net Debt to EBITDA | 2.78 | 2.61 | 3.26 |
| Current Ratio | 0.83 | 0.79 | 0.87 |
| Quick Ratio | 0.48 | 0.46 | 0.53 |
While leverage is relatively high, the ability to cover interest and operational costs mitigates potential risks, maintaining stability.
📈 Fundamental Strength & Profitability
Analyzing profitability and margins reveals the company's operational efficiency, with Sherwin-Williams exhibiting favorable margins and returns on equity and assets.
| Metrics | 2023 | 2024 | 2025 |
|---|---|---|---|
| Return on Equity | 64.29% | 66.19% | 55.86% |
| Return on Assets | 10.41% | 11.35% | 9.92% |
| Net Margin | 10.36% | 11.61% | 10.89% |
| EBIT Margin | 15.30% | 16.74% | 16.15% |
| EBITDA Margin | 18.00% | 19.44% | 18.65% |
| Gross Margin | 46.67% | 48.47% | 48.94% |
High profitability ratios indicate strong company fundamentals, ensuring potential for continued dividend payments and capital appreciation.
📉 Price Development
✅ Dividend Scoring System
| Criteria | Score (1-5) | |
|---|---|---|
| Dividend yield | 2 | |
| Dividend Stability | 5 | |
| Dividend Growth | 3 | |
| Payout Ratio | 4 | |
| Financial Stability | 3 | |
| Dividend Continuity | 5 | |
| Cashflow Coverage | 4 | |
| Balance Sheet Quality | 3 |
Total Score: 29/40
🗣️ Rating
Overall, The Sherwin-Williams Company demonstrates a solid history of dividend stability with moderate growth potential. While its dividend yield is modest, the company's efficient payout ratios and robust cash flow support ongoing shareholder returns. However, potential investors should consider the impact of its leveraged structure and focus on long-term commitments in capital efficiency improvements. This makes Sherwin-Williams an attractive choice for risk-moderate investors seeking stable, long-term dividend returns.
Smart Data Insight
Master the Perfect Entry & Exit for this Stock
Don't leave your profits to chance. Historically, this stock follows specific seasonal patterns that institutional traders use to maximize returns.
- ✅ Identify the "Golden Buying Window"
- ✅ Avoid high-risk correction cycles
- ✅ Backtested data from the last 20+ years