April 13, 2026 a 02:46 am

SHW: Dividend Analysis - The Sherwin-Williams Company
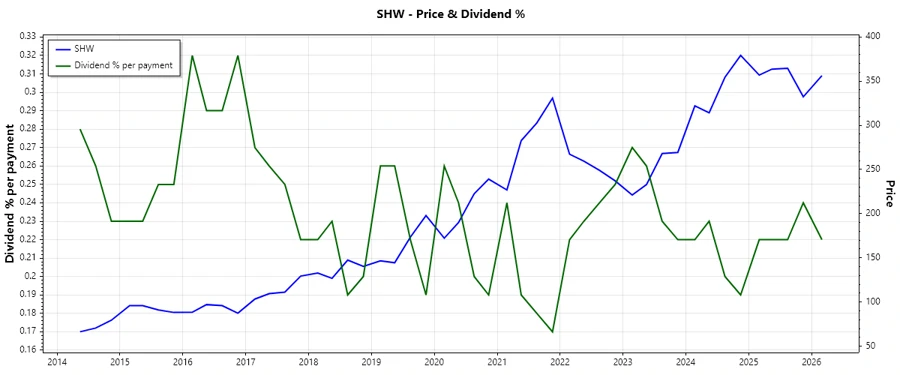
The Sherwin-Williams Company presents an intriguing investment opportunity due to its robust dividend profile. With a long-standing dividend history of 42 years, the company exhibits stability and continued commitment to rewarding shareholders. Despite a modest dividend yield of 0.89%, the consistency and growth illustrate potential value for patient investors. The company has not cut or suspended dividends, reflecting its strong financial foundation.
📊 Overview
| Key Metric | Value |
|---|---|
| Sector | Materials |
| Dividend yield | 0.89% |
| Current dividend per share | 3.21 USD |
| Dividend history | 42 years |
| Last cut or suspension | None |
🗣️ Dividend History
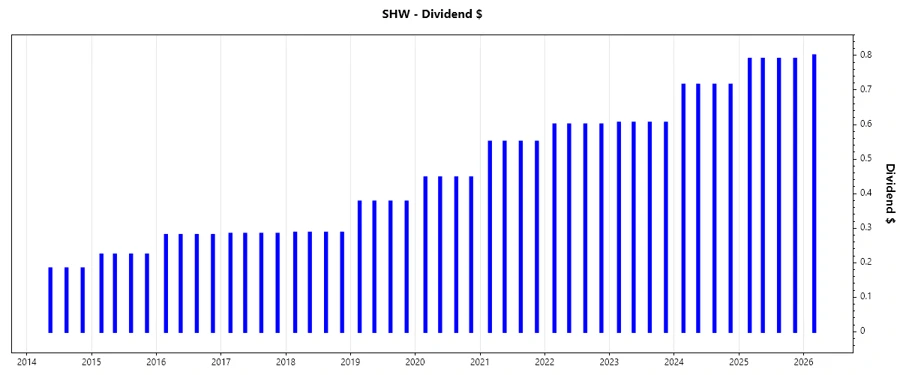
The Sherwin-Williams Company has maintained a stable and growing dividend streak, which is crucial for income-focused investors. The company's ability to sustain and increase dividends over decades reinforces its financial resilience.
| Year | Dividend per Share (USD) |
|---|---|
| 2026 | 0.80 |
| 2025 | 3.16 |
| 2024 | 2.86 |
| 2023 | 2.42 |
| 2022 | 2.40 |
📈 Dividend Growth
Consistent dividend growth is a critical indicator of a company's financial health and long-term viability. Sherwin-Williams has shown commendable growth, signifying its profitability and effective capital utilization.
| Time | Growth |
|---|---|
| 3 years | 9.60% |
| 5 years | 12.08% |
The average dividend growth is 12.08% over 5 years. This shows moderate but steady dividend growth.
✅ Payout Ratio
Evaluating the payout ratio helps determine the sustainability of dividends. A manageable payout ratio indicates that a company's earnings are sufficient to cover dividends without financial strain.
| Key figure ratio | Value |
|---|---|
| EPS-based | 30.75% |
| Free cash flow-based | 29.92% |
A payout ratio of 30.75% (EPS) and 29.92% (FCF) suggests a conservative approach, providing ample room for future dividend increases while ensuring financial flexibility.
⚠️ Cashflow & Capital Efficiency
An analysis of cash flow and capital efficiency illustrates a company's operational efficiency and financial health. These metrics offer insights into the effective use of capital and the ability to generate free cash flow.
| Year | 2025 | 2024 | 2023 |
|---|---|---|---|
| Free Cash Flow Yield | 3.32% | 2.41% | 3.31% |
| Earnings Yield | 3.22% | 3.10% | 3.00% |
| CAPEX to Operating Cash Flow | 23.11% | 33.93% | 25.23% |
| Stock-based Compensation to Revenue | 0.52% | 0.60% | 0.50% |
| Free Cash Flow / Operating Cash Flow Ratio | 76.89% | 66.06% | 74.77% |
Sherwin-Williams exhibits efficient capital use, with a solid free cash flow yield and healthy operating cash flow ratios, suggesting promising cash flow stability and effective capital management.
📉 Balance Sheet & Leverage Analysis
Analyzing the balance sheet and leverage ratios provides insight into the company's financial stability, liquidity, and how effectively it manages its debt obligations.
| Year | 2025 | 2024 | 2023 |
|---|---|---|---|
| Debt-to-Equity | 3.16 | 2.94 | 3.18 |
| Debt-to-Assets | 56.11% | 50.41% | 51.45% |
| Debt-to-Capital | 75.97% | 74.62% | 76.07% |
| Net Debt to EBITDA | 3.26 | 2.61 | 2.78 |
| Current Ratio | 0.87 | 0.79 | 0.83 |
| Quick Ratio | 0.53 | 0.46 | 0.48 |
The balance sheet reflects a moderate level of financial leverage with stable liquidity metrics. However, a lower current and quick ratio suggests room for improvement in liquidity management.
📈 Fundamental Strength & Profitability
The fundamental strength and profitability ratios offer a comprehensive view of a company's operational efficiency and ability to generate profit, crucial for long-term sustainability and growth.
| Year | 2025 | 2024 | 2023 |
|---|---|---|---|
| Return on Equity | 55.86% | 66.19% | 64.29% |
| Return on Assets | 9.92% | 11.35% | 10.41% |
| Margins: Net | 10.89% | 11.61% | 10.36% |
| EBIT | 16.15% | 16.74% | 15.30% |
| EBITDA | 18.65% | 19.45% | 18.00% |
| Gross | 48.94% | 48.47% | 46.67% |
| Research & Development to Revenue | 0% | 0% | 0% |
| Stock-based Compensation to Revenue | 0.38% | 0.60% | 0.50% |
Sherwin-Williams demonstrates strong profitability indicators, particularly in return on equity and asset utilization, underscoring its operational efficiency and competitiveness in the market.
👥 Dividend Scoring System
| Criteria | Score | Score Bar |
|---|---|---|
| Dividend yield | 2 | |
| Dividend Stability | 5 | |
| Dividend growth | 4 | |
| Payout ratio | 4 | |
| Financial stability | 3 | |
| Dividend continuity | 5 | |
| Cashflow Coverage | 3 | |
| Balance Sheet Quality | 3 |
Total Score: 29/40
🔍 Rating
Sherwin-Williams offers a compelling dividend profile with its strong historical performance and commitment to consistent dividend payments. While the yield is moderate, the robust growth and exemplary dividend history make it an attractive choice for long-term investors seeking stability and incremental income. Investors are advised to consider this company for its resilient financial standing and potential for steady returns.