September 01, 2025 a 03:31 am


SHW: Dividend Analysis - The Sherwin-Williams Company
The Sherwin-Williams Company, a stalwart in the paint and coatings industry, offers a modest dividend yield of 0.85% with a storied history of consistent payouts. While the yield may not be the highest, its steadfast increase over the years, coupled with a robust dividend history spanning over four decades, exemplifies reliability. The company's disciplined payout ratios and steady cash flow further bolster its position as a reliable income-generating asset in a well-diversified portfolio.
📊 Overview
Analyzing the core dividend metrics of The Sherwin-Williams Company helps investors comprehend its financial commitments towards shareholder returns.
| Sector | Dividend Yield | Current Dividend per Share | Dividend History | Last Cut or Suspension |
|---|---|---|---|---|
| Specialty Chemicals | 0.85 % | 2.85 USD | 41 years | None |
📈 Dividend History
The historical context of dividends is crucial as it reflects management's consistency and commitment to returning value to shareholders. With a strong history of increasing dividends over 41 years, Sherwin-Williams has proven its ability to sustain payouts through economic cycles.
| Year | Dividend per Share (USD) |
|---|---|
| 2025 | 2.37 |
| 2024 | 2.86 |
| 2023 | 2.42 |
| 2022 | 2.40 |
| 2021 | 2.20 |
📈 Dividend Growth
Assessing the growth of dividends provides insight into the company's earnings growth and future payout potential. Moderate and consistent growth is often a sign of sound financial health and strategic management.
| Time | Growth |
|---|---|
| 3 years | 9.14 % |
| 5 years | 13.68 % |
The average dividend growth is 13.68 % over 5 years. This shows moderate but steady dividend growth.
📊 Payout Ratio
The payout ratio evaluates the proportion of earnings distributed to shareholders, providing insights into sustainability and dividend coverage. Low payout ratios suggest the ability to sustain dividends during downturns.
| Key Figure | Ratio |
|---|---|
| EPS-based | 27.84 % |
| Free cash flow-based | 32.94 % |
The EPS-based payout ratio of 27.84 % and FCF-based payout ratio of 32.94 % demonstrate a disciplined approach, indicating a robust capacity for continued dividends and potential increases.
📊 Cashflow & Capital Efficiency
Cash flow metrics are pivotal in assessing a company's operational efficiency and its ability to sustain and grow dividend payments. These metrics also indicate the firm’s capital allocation efficiency and risk management.
| Year | Free Cash Flow Yield | Earnings Yield | CAPEX to Operating Cash Flow | Stock-based Compensation to Revenue | Free Cash Flow / Operating Cash Flow Ratio |
|---|---|---|---|---|---|
| 2024 | 2.41 % | 3.10 % | 33.93 % | 0.60 % | 66.06 % |
| 2023 | 3.31 % | 3.00 % | 25.23 % | 0.50 % | 74.77 % |
| 2022 | 2.08 % | 3.30 % | 33.57 % | 0.45 % | 66.43 % |
The cash flow figures depict a healthy free cash flow yield and an efficient capital allocation strategy, affirming the company's ability to invest in growth while maintaining shareholder payouts.
📊 Balance Sheet & Leverage Analysis
The balance sheet is crucial in evaluating financial stability and leverage, which are indicators of a company's long-term financial health and its ability to sustain dividends under financial stress.
| Year | Debt-to-Equity | Debt-to-Assets | Debt-to-Capital | Net Debt to EBITDA | Current Ratio | Quick Ratio | Financial Leverage |
|---|---|---|---|---|---|---|---|
| 2024 | 2.94 | 50.41 % | 74.62 % | 3.10 | N/A | 0.46 | 5.83 |
| 2023 | 3.18 | 51.44 % | 76.06 % | 2.78 | N/A | 0.48 | 6.18 |
| 2022 | 4.03 | 55.36 % | 80.13 % | 3.10 | N/A | 0.55 | 7.28 |
The leverage ratios present a moderate level of debt, which, while significant, is countered by healthy coverage metrics, indicating manageable financial obligations.
📊 Fundamental Strength & Profitability
The fundamental strength and profitability measures highlight the company’s core financial performance, reflecting its efficiency in generating profits relative to its resources and operational cost management.
| Year | Return on Equity | Return on Assets | ROIC | Net Margin | EBIT Margin | EBITDA Margin | Gross Margin | R&D to Revenue |
|---|---|---|---|---|---|---|---|---|
| 2024 | 66.19 % | 11.35 % | 15.42 % | 11.61 % | 16.29 % | 16.33 % | 48.47 % | N/A |
| 2023 | 64.29 % | 10.41 % | 15.18 % | 10.36 % | 15.30 % | 18.00 % | 46.67 % | N/A |
| 2022 | 65.12 % | 8.94 % | 13.27 % | 9.12 % | 13.44 % | 17.94 % | 42.10 % | N/A |
The company showcases impressive profitability metrics, with strong returns and healthy margins, underscoring its operational efficiency and effective resource utilization.
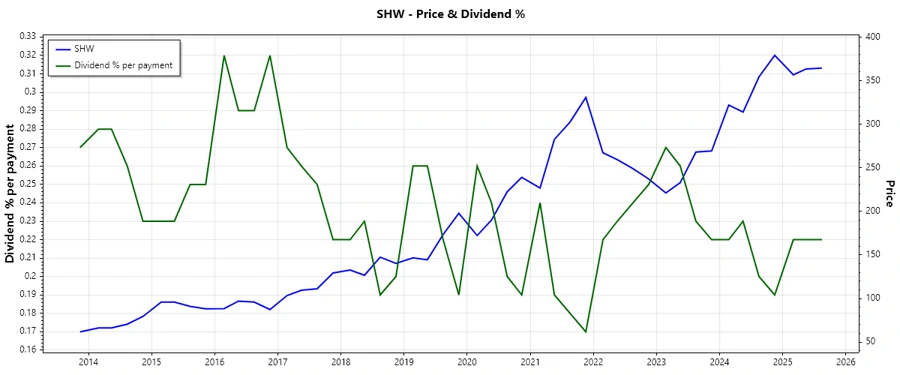
📈 Price Development
📊 Dividend Scoring System
| Category | Score (1-5) | Score Bar |
|---|---|---|
| Dividend Yield | 2 | |
| Dividend Stability | 5 | |
| Dividend Growth | 4 | |
| Payout Ratio | 5 | |
| Financial Stability | 4 | |
| Dividend Continuity | 5 | |
| Cashflow Coverage | 4 | |
| Balance Sheet Quality | 3 |
Total Score: 32/40
✅ Rating
Sherwin-Williams stands as a robust candidate for dividend investors, with a strong track record of stability reflected through over 40 years of uninterrupted dividend growth. While the yield is currently modest, the potential for capital appreciation coupled with resilience in dividend payments makes it a worthwhile consideration for long-term investment strategies.
Smart Data Insight
Master the Perfect Entry & Exit for this Stock
Don't leave your profits to chance. Historically, this stock follows specific seasonal patterns that institutional traders use to maximize returns.
- ✅ Identify the "Golden Buying Window"
- ✅ Avoid high-risk correction cycles
- ✅ Backtested data from the last 20+ years