August 17, 2025 a 12:47 pm


SHW: Dividend Analysis - The Sherwin-Williams Company
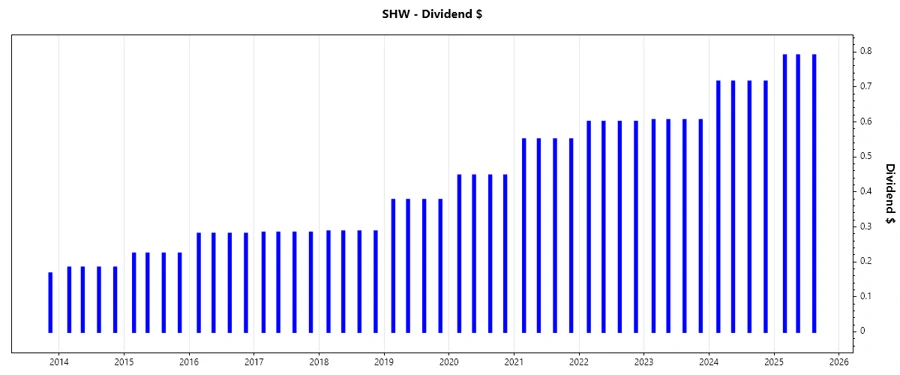
The Sherwin-Williams Company demonstrates a robust commitment to shareholders with a consistent and growing dividend history over 41 years. The company's disciplined approach towards earnings and free cash flow allocation contributes to its reliable dividend payout. However, the relatively low yield may appeal less to income-focused investors.
Overview 📊
The Sherwin-Williams Company, a leader in the specialty chemical sector, offers a current dividend yield of 0.85%. The current dividend per share stands at $2.85 USD, backed by a solid 41-year history of dividend payments without any recent cuts or suspensions.
| Characteristic | Data |
|---|---|
| Sector | Specialty Chemicals |
| Dividend Yield | 0.85% |
| Current Dividend per Share | $2.85 |
| Dividend History | 41 years |
| Last Cut/Suspension | None |
Dividend History 🗣️
A consistent dividend payment history reflects a company's confidence in its operational stability and capacity to generate cash flows. The Sherwin-Williams Company has demonstrated its commitment to providing shareholder value through uninterrupted dividend flows.
| Year | Dividend per Share (USD) |
|---|---|
| 2025 | $2.37 |
| 2024 | $2.86 |
| 2023 | $2.42 |
| 2022 | $2.40 |
| 2021 | $2.20 |
Dividend Growth 📈
Dividend growth is pivotal for indicating long-term financial health and management's commitment to returning value to shareholders. The Sherwin-Williams Company shows a stable depreciation of dividends with moderate growth rates.
| Time | Growth |
|---|---|
| 3 years | 9.14% |
| 5 years | 13.68% |
The average dividend growth is 13.68% over 5 years. This shows moderate but steady dividend growth.
Payout Ratio ⚠️
Payout ratios help evaluate the sustainability of dividend distributions. The Sherwin-Williams Company's financial prudence is evident from its EPS-based payout ratio of 27.84% and FCF-based ratio of 32.94%, suggesting robustness in its ability to maintain and potentially grow dividends.
| Key Figure | Ratio |
|---|---|
| EPS-based | 27.84% |
| Free Cash Flow-based | 32.94% |
The payout ratios reveal a balanced approach towards earnings distribution, ensuring that dividends remain sustainable without compromising on growth or financial strength.
Cashflow & Capital Efficiency ✅
Cashflow analysis is vital for understanding a firm's operational efficacy and financial prudence. The Sherwin-Williams Company's metrics indicate a steady balance between cash flows and capital expenditures.
| Year | 2024 | 2023 | 2022 |
|---|---|---|---|
| Free Cash Flow Yield | 2.41% | 3.31% | 2.08% |
| Earnings Yield | 3.10% | 3.00% | 3.30% |
| CAPEX to Operating Cash Flow | 33.93% | 25.23% | 33.57% |
| Stock-based Compensation to Revenue | 0.60% | 0.50% | 0.45% |
| Free Cash Flow/Operating Cash Flow Ratio | 66.07% | 74.77% | 66.43% |
These figures suggest efficient capital allocation with sound financial management, enabling strategic growth while maintaining healthy cash reserves.
Balance Sheet & Leverage Analysis ⚠️
A thorough balance sheet evaluation shows how well a company manages its debt and liquidity. Sherwin-Williams displays a leveraged structure with high but managed debt ratios, balanced by decent solvency metrics.
| Year | 2024 | 2023 | 2022 |
|---|---|---|---|
| Debt-to-Equity | 2.94 | 3.18 | 4.03 |
| Debt-to-Assets | 0.50 | 0.51 | 0.55 |
| Debt-to-Capital | 0.75 | 0.76 | 0.80 |
| Net Debt to EBITDA | 3.10 | 2.78 | 3.10 |
| Current Ratio | 0.79 | 0.83 | 0.99 |
| Quick Ratio | 0.46 | 0.48 | 0.55 |
| Financial Leverage | 5.83 | 6.18 | 7.28 |
While leveraging enhances returns, careful monitoring is needed to maintain financial flexibility in navigating market fluctuations.
Fundamental Strength & Profitability 📊
Profitability indicators showcase core business performance and operational efficiency. Sherwin-Williams displays strong return metrics reinforcing exceptional shareholder value generation.
| Year | 2024 | 2023 | 2022 |
|---|---|---|---|
| Return on Equity | 66.19% | 64.29% | 65.12% |
| Return on Assets | 11.34% | 10.41% | 8.94% |
| Margins: Net | 11.61% | 10.36% | 9.12% |
| Margins: EBIT | 16.29% | 15.30% | 13.44% |
| Margins: EBITDA | 16.33% | 18.00% | 17.94% |
| Margins: Gross | 48.47% | 46.67% | 42.10% |
| Research & Development to Revenue | 0% | 0.85% | 0.54% |
Strong profitability ratios confirm a balance between cost management and revenue generation, supporting sustainable expansion strategies.
Price Development 📈
Dividend Scoring System 📊
| Criteria | Score | Description |
|---|---|---|
| Dividend yield | 2 | |
| Dividend Stability | 5 | |
| Dividend Growth | 3 | |
| Payout Ratio | 4 | |
| Financial Stability | 4 | |
| Dividend Continuity | 5 | |
| Cashflow Coverage | 4 | |
| Balance Sheet Quality | 3 |
Total Score: 30/40
Rating 📉
In summary, The Sherwin-Williams Company is a stalwart within the specialty chemicals sector, best suited for investors valuing dividend reliability and moderate growth. The company's financial metrics underline a disciplined approach towards earnings management, ensuring sustained shareholder returns. However, the lower dividend yield might not meet high-income demands.
Smart Data Insight
Master the Perfect Entry & Exit for this Stock
Don't leave your profits to chance. Historically, this stock follows specific seasonal patterns that institutional traders use to maximize returns.
- ✅ Identify the "Golden Buying Window"
- ✅ Avoid high-risk correction cycles
- ✅ Backtested data from the last 20+ years