January 30, 2026 a 09:03 am

SCHW: Trend and Support & Resistance Analysis - The Charles Schwab Corporation
The Charles Schwab Corporation has demonstrated a complex market performance through fluctuating trends and patterns over the analyzed period. With diverse segments offering brokerage, banking, and asset management services, it remains a stalwart in the industry. Analyzing the technical charts reveals crucial insights into potential market movements for SCHW.
Trend Analysis
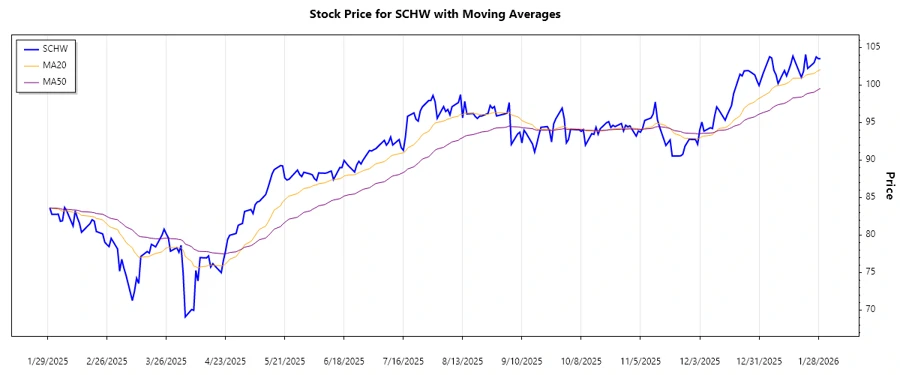
The analysis of the closing prices for The Charles Schwab Corporation reveals that the recent trend is an upward movement, observed through the calculated EMAs. The EMA20 stands higher than the EMA50, confirming the recent bullish sentiment.
| Date | Closing Price | Trend |
|---|---|---|
| 2026-01-29 | 103.47 | ▲ Upward |
| 2026-01-28 | 103.47 | ▲ Upward |
| 2026-01-27 | 103.72 | ▲ Upward |
| 2026-01-26 | 102.94 | ▲ Upward |
| 2026-01-23 | 102.18 | ▲ Upward |
| 2026-01-22 | 104.05 | ▲ Upward |
| 2026-01-21 | 101.79 | ▲ Upward |
With the EMA20 surpassing the EMA50, the trend direction is confirmed as upward, suggesting potential for continued growth.
Support and Resistance
Calculating the support and resistance levels for SCHW reveals key zones. These zones are critical in understanding potential price movement and establishing trading strategies.
| Zone Type | From | To |
|---|---|---|
| Support | 92.00 | 94.00 |
| Support | 88.00 | 90.00 |
| Resistance | 104.00 | 106.00 |
| Resistance | 108.00 | 110.00 |
Currently, the closing price is approaching the higher resistance zone, indicating potential challenges in breaking through unless supported by strong momentum.
This technical setup suggests caution as the stock may face resistance at higher levels, requiring significant buying pressure to continue its advance.
Conclusion
The technical analysis on The Charles Schwab Corporation stock highlights a prevailing upward trend amidst an intricate support and resistance framework. Investors can anticipate potential opportunities as the stock navigates existing market barriers. However, the resistance zones may pose challenges without substantial market momentum, emphasizing the need for strategic entry and exit points in trading tactics.