December 28, 2025 a 08:15 am
SCHW: Trend and Support & Resistance Analysis - The Charles Schwab Corporation
The Charles Schwab Corporation, a leader in wealth management and financial advisory, shows significant fluctuations in its stock price, primarily reflecting the broader market dynamics. Recent data indicate a recovery phase, hinting at an emerging upward momentum. Investors should remain cautious as economic factors may influence this trend reversal.
Trend Analysis
| Date | Close Price | Trend |
|---|---|---|
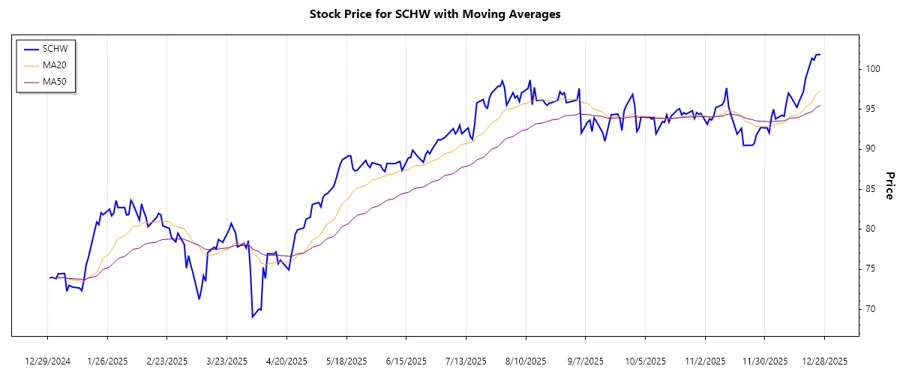
| 2025-12-26 | 101.89 | ▲ Uptrend |
| 2025-12-24 | 101.85 | ▲ Uptrend |
| 2025-12-23 | 101.18 | ▲ Uptrend |
| 2025-12-22 | 101.41 | ▲ Uptrend |
| 2025-12-19 | 98.82 | ▲ Uptrend |
| 2025-12-18 | 97.23 | ▲ Uptrend |
| 2025-12-17 | 96.61 | ▲ Uptrend |
The recent closing prices display an uptrend as indicated by the EMA20 surpassing the EMA50, suggesting improving investor sentiment.
Support and Resistance
| Zone Type | From | To |
|---|---|---|
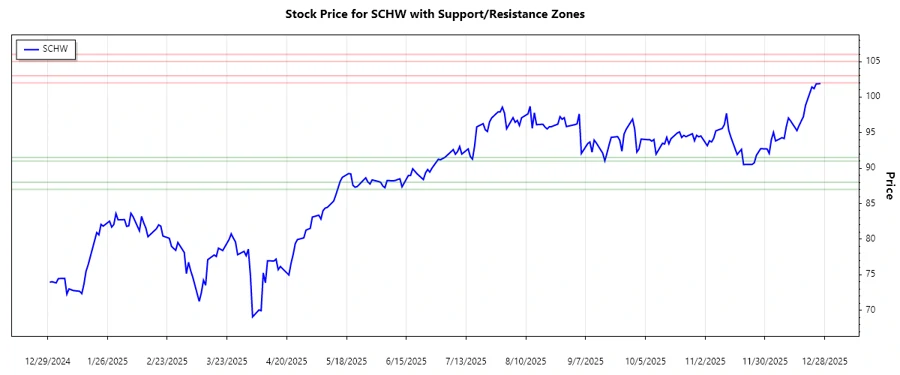
| Support 1 | 91.00 | 91.50 |
| Support 2 | 87.00 | 88.00 |
| Resistance 1 | 102.00 | 103.00 |
| Resistance 2 | 105.00 | 106.00 |
The current price of 101.89 is in proximity to the primary resistance zone, suggesting potential barriers to further immediate gains unless a breakout occurs.
Conclusion
Charles Schwab's stock is at a pivotal point, with recent trends indicating potential for upward movement. The ability to sustain these gains may hinge on broader economic conditions and company performance metrics. Resistance levels will be crucial in determining whether this rally has legs or will be met with selling pressure. Investors must monitor macroeconomic indicators closely as they weigh the potential for sustained growth against possible downturns.