December 04, 2025 a 06:44 am
SCHW: Fibonacci Analysis - The Charles Schwab Corporation
The Charles Schwab Corporation, a pillar in wealth management and advisory services, has demonstrated resilience in its sector. Over the last few months, the stock has exhibited significant movements. A detailed Fibonacci analysis can provide insights into potential future price actions.
Fibonacci Analysis
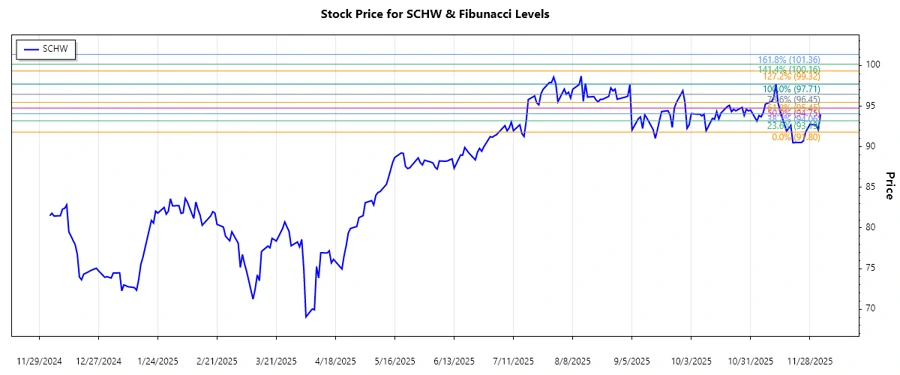
The historical price data for The Charles Schwab Corporation (SCHW) shows a dominant recent upward trend from October to December 2025. This trend presents an opportunity to analyze potential retracement levels for strategic investment decisions.
| Attribute | Details |
|---|---|
| Trend Start Date | 2025-10-09 |
| Trend End Date | 2025-12-03 |
| High Point (Price and Date) | $97.71 on 2025-11-12 |
| Low Point (Price and Date) | $91.80 on 2025-11-26 |
Fibonacci Levels
| Level | Price |
|---|---|
| 0.236 | $93.57 |
| 0.382 | $94.75 |
| 0.5 | $95.48 |
| 0.618 | $96.21 |
| 0.786 | $97.28 |
Current price at $93.99 resides below the 0.236 Fibonacci retracement level, suggesting potential for further upward movement to retest higher retracement zones, translating to potential support near current levels.
Conclusion
The Charles Schwab Corporation's stock recently experienced a notable upward trend. Its current pricing near the lower Fibonacci retracement level suggests potential upward momentum. This could present a buying opportunity as technical indicators point to possible support around $93.99. However, market volatility and external factors influencing the financial sector pose risks that need consideration before making investment decisions. Thus, continuous monitoring of price action around key Fibonacci levels is essential for informed decision-making.