September 14, 2025 a 11:45 am

SCHW: Fibonacci Analysis - The Charles Schwab Corporation
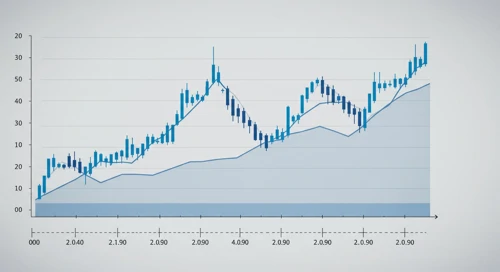
The Charles Schwab Corporation has been exhibiting a strong recovery trend recently, with its stock price climbing steadily after experiencing a low earlier this year. The company’s diverse portfolio of financial services positions it well in the market, even amidst economic fluctuations. Investors may find growing confidence, given its resilience and strategic initiatives that enhance market share and client acquisitions.
Fibonacci Analysis
| Analysis Data | Details |
|---|---|
| Start Date | 2024-11-08 |
| End Date | 2025-09-11 |
| High Point (Price & Date) | $98.69 on 2025-08-12 |
| Low Point (Price & Date) | $63.40 on 2024-10-03 |
| Fibonacci Levels |
|
| Current Retraction Zone | 0.618 |
| Technical Interpretation | The current price is in the 0.618 Fibonacci retracement level, which might act as a strong support area, potentially indicating a pause or reversal in the downtrend. |
Conclusion
The Charles Schwab Corporation appears to be in a resilient recovery phase, demonstrated by its steady rise from October 2024 to September 2025. This upward trajectory reflects the company’s robust business model and strategic adaptations in the financial sector. Nonetheless, with the stock presently in a retracement level, investors should be cautious of potential resistance or further consolidation. While the growth prospects remain positive, potential market volatility and economic conditions could impact short-term stock performance.
Smart Data Insight
Master the Perfect Entry & Exit for this Stock
Don't leave your profits to chance. Historically, this stock follows specific seasonal patterns that institutional traders use to maximize returns.
- ✅ Identify the "Golden Buying Window"
- ✅ Avoid high-risk correction cycles
- ✅ Backtested data from the last 20+ years