March 15, 2026 a 03:31 pm

The Charles Schwab Corporation: Dividend Analysis - SCHW
The Charles Schwab Corporation presents a compelling dividend opportunity with consistent payouts over 38 years. Its moderate yield of 1.21% might appear conservative, yet it promises sustained growth and reliability, appealing to cautious investors. Despite recent market challenges, Schwab’s disciplined payout strategy and robust financials underpin its commitment to shareholders.
📊 Overview
Schwab operates within the financial sector, delivering a dividend yield of 1.21%. With a current dividend per share of 1.31 USD, Schwab's consistent payout over 38 years without major cuts reinforces its stability.
| Metric | Value |
|---|---|
| Sector | Financials |
| Dividend yield | 1.21 % |
| Current dividend per share | 1.314 USD |
| Dividend history | 38 years |
| Last cut or suspension | None |
📉 Dividend History
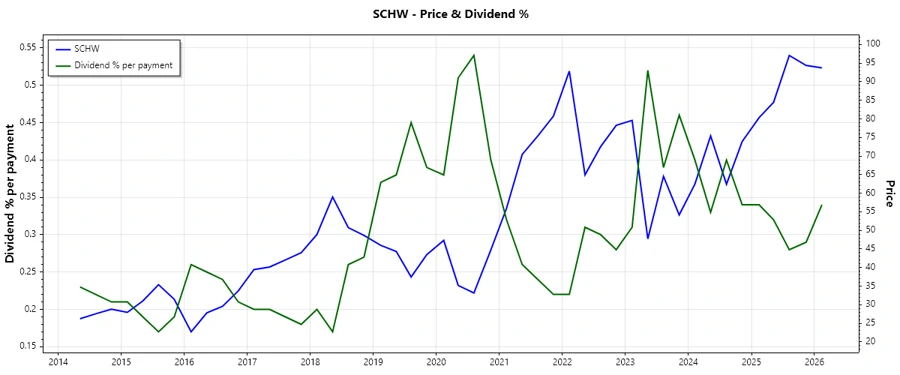
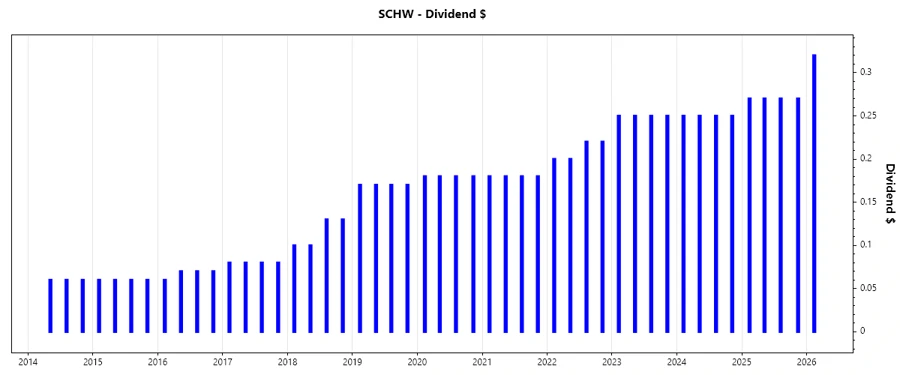
A core strength of Schwab is its impressive 38-year dividend history, which speaks volumes of its commitment to rewarding shareholders. Historical continuity in dividends is a key indicator of a company's financial health and shareholder alignment.
| Year | Dividend Per Share (USD) |
|---|---|
| 2026 | 0.32 |
| 2025 | 1.08 |
| 2024 | 1.00 |
| 2023 | 1.00 |
| 2022 | 0.84 |
📈 Dividend Growth
Dividend growth is crucial as it reflects a company's potential to increase shareholder wealth over time. Schwab demonstrated an 8.44% growth over the last 5 years, highlighting moderate yet persistent growth.
| Time | Growth |
|---|---|
| 3 years | 8.74 % |
| 5 years | 8.45 % |
The average dividend growth is 8.45 % over 5 years. This shows moderate but steady dividend growth.
🗣️ Payout Ratio
The payout ratio is pivotal in assessing dividend sustainability. Schwab's EPS-based ratio at 26.31% and FCF-based ratio at 26.65% indicate a conservative approach, ensuring ample room for reinvestment while securing payouts.
| Key figure ratio | Value |
|---|---|
| EPS-based | 26.31 % |
| Free cash flow-based | 26.65 % |
These ratios reflect a well-balanced dividend policy, balancing rewards with growth potential.
✅ Cashflow & Capital Efficiency
Evaluating cash flow efficiency is essential for understanding a company's operational health. Schwab's history of effective CAPEX allocation and solid free cash flow to operating cash flow ratios portrays strong financial discipline, driving sustained shareholder value.
| Year | 2025 | 2024 | 2023 |
|---|---|---|---|
| Free Cash Flow Yield | 4.95 % | 1.52 % | 15.05 % |
| Earnings Yield | 5.00 % | 4.39 % | 4.04 % |
| CAPEX to Operating Cash Flow | 5.88 % | 23.22 % | 3.57 % |
| Stock-based Compensation to Revenue | 1.14 % | 1.30 % | 1.25 % |
| Free Cash Flow / Operating Cash Flow Ratio | 94.11 % | 76.78 % | 96.43 % |
This financial stability assures consistent cash flow coverage and judicious capital efficiency, positioning Schwab favorably in the market.
⚠️ Balance Sheet & Leverage Analysis
Understanding leverage ratios offers insight into financial risk. Schwab maintains a manageable debt profile, with favorable ratios that indicate a low-risk standing, and high liquidity ratios suggest robust financial health.
| Year | 2025 | 2024 | 2023 |
|---|---|---|---|
| Debt-to-Equity | 0.65 | 0.93 | 1.44 |
| Debt-to-Assets | 0.06 | 0.09 | 0.12 |
| Debt-to-Capital | 0.39 | 0.48 | 0.59 |
| Net Debt to EBITDA | 2.10 | 0.33 | 2.04 |
| Current Ratio | 17.83 | 0.54 | 0.54 |
| Quick Ratio | 17.83 | 0.54 | 0.54 |
Schwab's judicious use of leverage and solid liquidity metrics underscore financial strength, enhancing investor confidence.
🔍 Fundamental Strength & Profitability
Fundamentals like return ratios and margins provide deeper insights into operational efficiency. Schwab's impressive return on equity and asset strength, coupled with healthy profit margins, project robust profitability to support future dividend policies.
| Year | 2025 | 2024 | 2023 |
|---|---|---|---|
| Return on Equity | 17.92 % | 12.28 % | 12.37 % |
| Return on Assets | 1.80 % | 1.24 % | 1.03 % |
| Net Profit Margin | 31.99 % | 22.85 % | 19.85 % |
| EBIT Margin | 49.42 % | 29.59 % | 24.99 % |
| EBITDA Margin | 54.34 % | 35.11 % | 30.23 % |
| Gross Margin | 80.28 % | 75.41 % | 73.81 % |
| Research & Development to Revenue | 0 % | 0 % | 0 % |
Such strong fundamentals suggest Schwab is well-positioned for profitability, sustaining its dividend policy and adding intrinsic value.
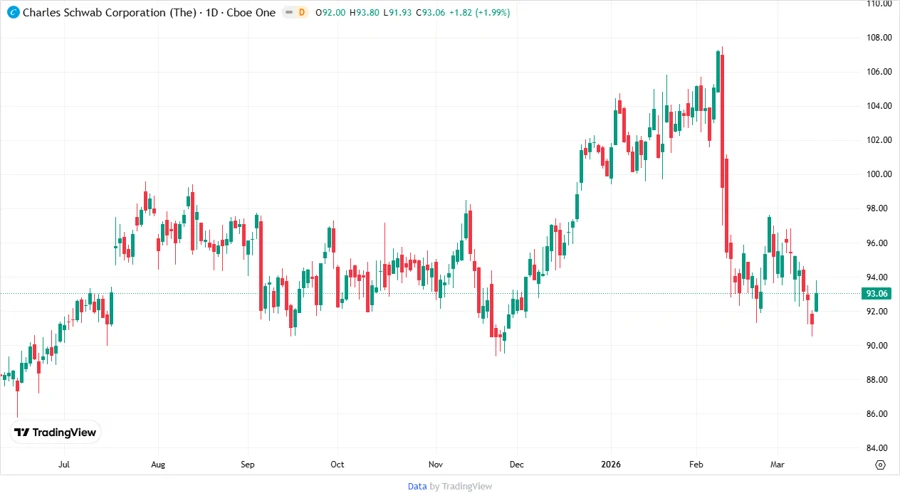
📊 Price Development
🧮 Dividend Scoring System
| Criterion | Points | Score Bar |
|---|---|---|
| Dividend yield | 3 | |
| Dividend Stability | 5 | |
| Dividend Growth | 4 | |
| Payout Ratio | 5 | |
| Financial Stability | 4 | |
| Dividend Continuity | 4 | |
| Cashflow Coverage | 5 | |
| Balance Sheet Quality | 4 |
Overall Score: 34/40
🗣️ Rating
Based on fundamental and quantitative analysis, The Charles Schwab Corporation displays solid dividend credentials, supported by a consistent payout policy, measured growth, and strong financial metrics. Thus, Schwab is recommended for long-term income-orientated investors seeking reliable dividend income with potential for capital appreciation.