February 24, 2026 a 07:46 am

SCHW: Dividend Analysis - The Charles Schwab Corporation
The Charles Schwab Corporation shows a sound dividend profile with consistent payouts over the years. Its focus on financial stability and continuous growth makes it a potential long-term investment. The solid dividends yield, combined with strong dividend history, provides investors with a reliable income stream.
📊 Overview
The Charles Schwab Corporation operates in the Financial sector, boasting a dividend yield of 1.21%. With a current dividend per share of 1.08 USD and a pristine history of 38 years without any cuts or suspensions, the company demonstrates a robust commitment to returning capital to its shareholders.
| Metric | Details |
|---|---|
| Sector | Financial |
| Dividend yield | 1.21% |
| Current dividend per share | 1.08 USD |
| Dividend history | 38 years |
| Last cut or suspension | None |
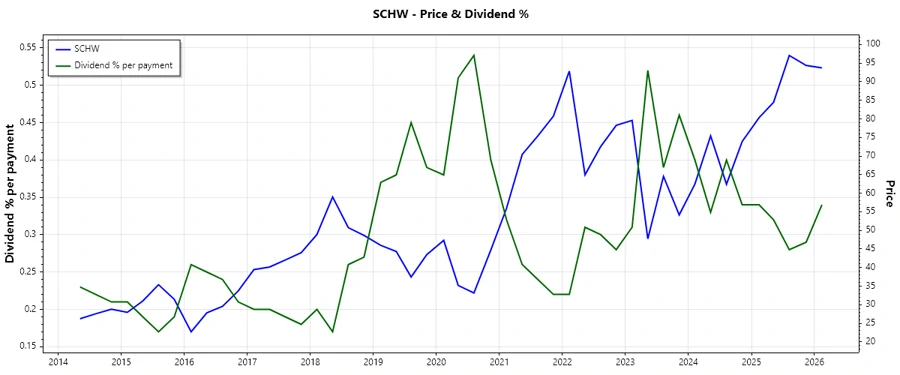
🗣️ Dividend History
The dividend history of The Charles Schwab Corporation underscores its reliability and dedication to shareholder returns. Historical performance of dividend payments is crucial for evaluating future potential income streams. Consistent payments over extended periods often signify a company's strong market position and financial health.
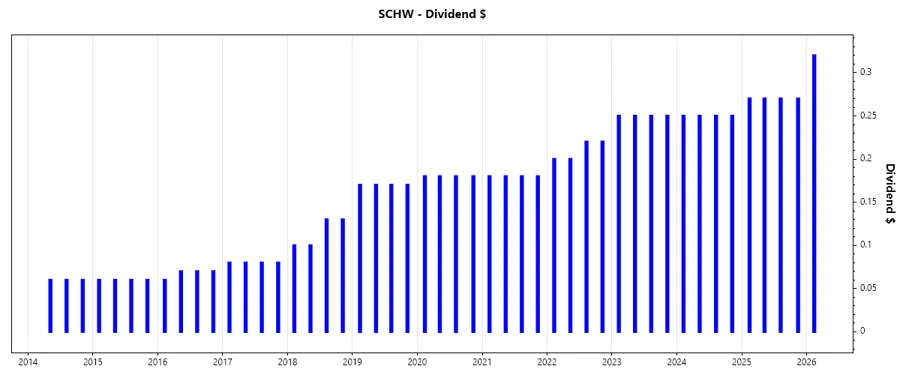
| Year | Dividend per Share (USD) |
|---|---|
| 2026 | 0.32 |
| 2025 | 1.08 |
| 2024 | 1.00 |
| 2023 | 1.00 |
| 2022 | 0.84 |
📈 Dividend Growth
The Charles Schwab Corporation has displayed moderate dividend growth, which is essential for countering inflation and enhancing investors' income over time. The consistent growth indicates a strong and stable financial standing, with the capability to continue increasing dividends.
| Time | Growth |
|---|---|
| 3 years | 8.74% |
| 5 years | 8.45% |
The average dividend growth is 8.45% over 5 years. This shows moderate but steady dividend growth, signaling confidence in future profitability.
⚠️ Payout Ratio
Payout ratios provide insight into the proportion of earnings a company is distributing as dividends. Lower ratios can indicate potential for future dividend increases, while high ratios may suggest sustainability concerns.
| Key figure | Ratio |
|---|---|
| EPS-based | 21.62% |
| Free cash flow-based | 20.24% |
The payout ratio of 21.62% (EPS) and 20.24% (FCF) reflects a conservative distribution policy, allowing ample room for reinvestment into business operations.
✅ Cashflow & Capital Efficiency
The evaluation of free cash flow and capital efficiency metrics is pivotal in assessing a firm's ability to generate cash relative to its capital requirements, impacting its dividend distribution potential.
| Year | 2023 | 2024 | 2025 |
|---|---|---|---|
| Free Cash Flow Yield | 15.05% | 1.52% | N/A |
| Earnings Yield | 4.04% | 4.39% | 5.00% |
| CAPEX to Operating Cash Flow | 3.57% | 23.22% | N/A |
| Stock-based Compensation to Revenue | 1.25% | 1.30% | N/A |
| Free Cash Flow / Operating Cash Flow Ratio | 96.43% | 76.78% | N/A |
The figures indicate efficient cash use in operations, signaling robust support for dividend distribution through sustainable cash flows and a prudent capital investment strategy.
📉 Balance Sheet & Leverage Analysis
An analysis of balance sheet metrics offers insights into a company's financial leverage, stability, and debt management. These metrics help assess risks related to capital structure and liquidity.
| Year | 2023 | 2024 | 2025 |
|---|---|---|---|
| Debt-to-Equity | 144.25% | 93.30% | 0.56% |
| Debt-to-Assets | 11.98% | 9.41% | 0.06% |
| Debt-to-Capital | 59.06% | 48.27% | 0.56% |
| Net Debt to EBITDA | 2.04 | 0.33 | -0.00 |
| Current Ratio | 0.54 | 0.54 | 2952.94 |
| Quick Ratio | 0.54 | 0.54 | 2952.94 |
| Financial Leverage | 12.04 | 9.91 | 9.94 |
The balance sheet metrics reflect a stable financial situation with manageable leverage, enhancing investor confidence in the company's long-term viability and dividend continuation.
💪 Fundamental Strength & Profitability
Evaluating profitability ratios such as ROE and margins provides insights into the company's operational efficiency and ability to generate returns on investments.
| Year | 2023 | 2024 | 2025 |
|---|---|---|---|
| Return on Equity (ROE) | 12.37% | 12.28% | 17.92% |
| Return on Assets (ROA) | 1.03% | 1.24% | 1.80% |
| Net Margin | 19.85% | 22.85% | 31.99% |
| EBIT Margin | 24.99% | 29.59% | 49.42% |
| EBITDA Margin | 30.23% | 35.11% | 54.34% |
| Gross Margin | 73.81% | 75.41% | 80.28% |
| R&D to Revenue | 0.00% | 0.00% | 0.00% |
The company's strong ROE and robust margins indicate efficient management and operational excellence, providing a solid foundation for sustainable profitability.
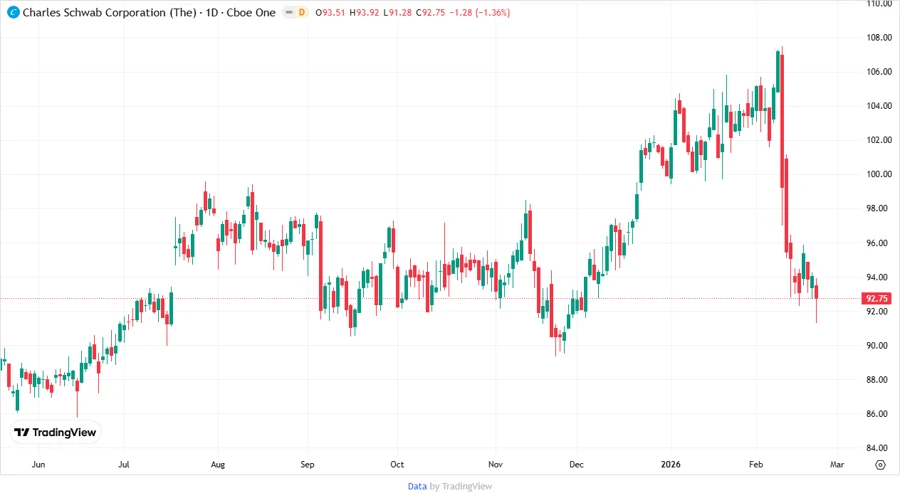
Price Development
🔍 Dividend Scoring System
| Criteria | Score | Visual Representation |
|---|---|---|
| Dividend yield | 4 | |
| Dividend Stability | 5 | |
| Dividend growth | 4 | |
| Payout ratio | 5 | |
| Financial stability | 5 | |
| Dividend continuity | 5 | |
| Cashflow Coverage | 4 | |
| Balance Sheet Quality | 5 |
Total Score: 37/40
Rating
The Charles Schwab Corporation receives a high dividend rating, showcasing an exemplary record of dividend payments and financial health. Its strong balance sheet and steady cash flow underpin the reliability of its dividend payments. With above-average growth prospects and fiscal prudence, SCHW is recommended for investors seeking stable income with potential for growth.
Smart Data Insight
Master the Perfect Entry & Exit for this Stock
Don't leave your profits to chance. Historically, this stock follows specific seasonal patterns that institutional traders use to maximize returns.
- ✅ Identify the "Golden Buying Window"
- ✅ Avoid high-risk correction cycles
- ✅ Backtested data from the last 20+ years