December 02, 2025 a 11:31 am


SCHW: Dividend Analysis - The Charles Schwab Corporation
The Charles Schwab Corporation, with a significant market capitalization of $168.6 billion and 1,819 million shares outstanding, is a prominent name in the financial services sector. The company demonstrates a modest dividend yield of 1.14%, maintaining a consistent history of dividends over the past 37 years. However, potential investors should consider the previous cutback in 2008 as part of the risk assessment. Given the present payout ratios and financial stability metrics, Charles Schwab offers an attractive proposition for income-focused investors.
📊 Overview
Charles Schwab exhibits a dividend yield of 1.14%, with the current dividend per share standing at $1.24. The firm has maintained dividend payments for an impressive 37 years, with the last suspension occurring in 2008, indicating a strong commitment to returning value to shareholders.
| Metric | Value |
|---|---|
| Sector | Financial Services |
| Dividend Yield | 1.14% |
| Current Dividend Per Share | $1.24 USD |
| Dividend History | 37 years |
| Last Cut or Suspension | 2008 |
🗣️ Dividend History
The sustained history of dividends is key to understanding a firm’s stability and shareholder value promise. Over the last few decades, Charles Schwab has shown resilience and growth in dividend payments, reinforcing investor confidence.
| Year | Dividend Per Share (USD) |
|---|---|
| 2025 | $1.08 |
| 2024 | $1.00 |
| 2023 | $1.00 |
| 2022 | $0.84 |
| 2021 | $0.72 |
📈 Dividend Growth
Examining dividend growth provides insights into the company's growth prospects and commitment to enhancing shareholder value. The growth rates over the last 3 and 5 years are indicators of this intent and future potential.
| Time | Growth |
|---|---|
| 3 years | 11.57% |
| 5 years | 8.02% |
The average dividend growth is 8.02% over 5 years. This shows moderate but steady dividend growth.
📉 Payout Ratio
Payout ratios are essential to gauge sustainability—particularly the percentage of earnings and free cash flow distributed as dividends. Charles Schwab's payout ratios shed light on the firm's capacity to sustain its dividends amid earnings fluctuations.
| Key Figure | Ratio |
|---|---|
| EPS-based | 27.30% |
| Free cash flow-based | -126.47% |
The EPS-based payout ratio of 27.30% is healthy and suggests earnings cover dividends comfortably. The negative FCF-based ratio indicates challenges, possibly due to recent investments impacting cash flow.
✅ Cashflow & Capital Efficiency
Cash flow dynamics and capital efficiency ratios are vital in assessing the operational health and long-term financial sustainability. These metrics provide insights into profit reinvestment and shareholder reward strategies.
| Metric | 2024 | 2023 | 2022 |
|---|---|---|---|
| Free Cash Flow Yield | 1.52% | 15.05% | 0.69% |
| Earnings Yield | 4.39% | 4.04% | 4.58% |
| CAPEX to Operating Cash Flow | 23.22% | 3.57% | 47.20% |
| Stock-based Compensation to Revenue | 1.30% | 1.25% | 1.64% |
| Free Cash Flow / Operating Cash Flow Ratio | 76.78% | 96.43% | 52.80% |
The data reflects a company actively investing in its future through CAPEX, with earnings yield offering a moderately positive return. Cash flow variability points to volatility, yet the operational efficiency remains commendable.
✅ Balance Sheet & Leverage Analysis
Evaluating the balance sheet provides insights into financial leverage and stability. These metrics underscore Charles Schwab's debt management strategies and its resilience against financial uncertainties.
| Metric | 2024 | 2023 | 2022 |
|---|---|---|---|
| Debt-to-Equity | 0.93 | 1.44 | 1.03 |
| Debt-to-Assets | 0.09 | 0.12 | 0.07 |
| Debt-to-Capital | 0.48 | 0.59 | 0.51 |
| Net Debt to EBITDA | 0.33 | 2.04 | -0.22 |
| Current Ratio | - | - | 0.52 |
| Quick Ratio | 0.54 | 0.54 | 0.52 |
The company has shown prudent debt-management practices, with leverage ratios suggesting manageable levels of debt. The slightly high financial leverage underscores potential risk mitigation through robust liquidity management strategies.
✅ Fundamental Strength & Profitability
Fundamental metrics, including returns on various capital bases and profitability margins, serve as indicators of operational performance and competitive positioning in the market.
| Metric | 2024 | 2023 | 2022 |
|---|---|---|---|
| Return on Equity | 12.28% | 12.37% | 19.62% |
| Return on Assets | 1.24% | 1.03% | 1.30% |
| Net Profit Margin | 22.85% | 19.85% | 32.20% |
| EBIT Margin | 29.59% | 24.99% | 42.09% |
| EBITDA Margin | 35.11% | 30.23% | 47.68% |
| Research & Development to Revenue | 0% | 0% | 0% |
The firm's profitability metrics highlight robust operational efficiency, maintaining solid returns and margins. The absence of R&D spending reflects the sector's focus on service-based scalability and client retention strategies.
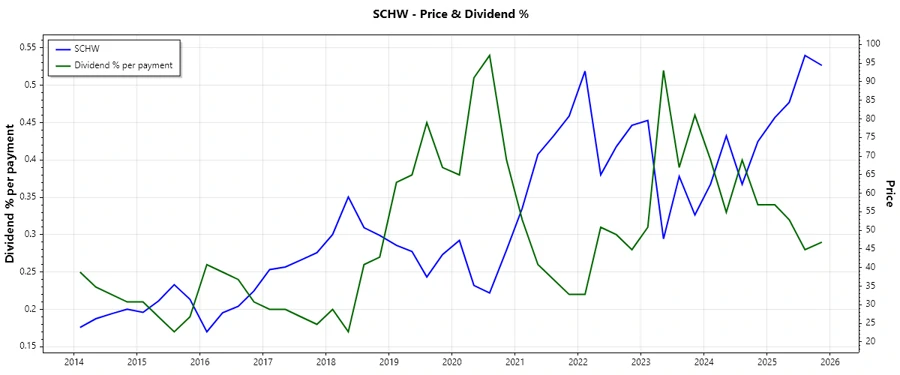
📈 Price Development
✅ Dividend Scoring System
| Criteria | Score | Description |
|---|---|---|
| Dividend yield | 3 | |
| Dividend Stability | 4 | |
| Dividend growth | 4 | |
| Payout ratio | 3 | |
| Financial stability | 5 | |
| Dividend continuity | 4 | |
| Cashflow Coverage | 2 | |
| Balance Sheet Quality | 3 |
Total Score: 28/40
✅ Rating
In conclusion, The Charles Schwab Corporation presents a stable and promising investment option with a focus on consistent dividend yields and strong financial health. While the cash flow coverage requires monitoring, the firm's historical commitment to dividends and financial prudence make it a viable addition for income-focused portfolios.