October 04, 2025 a 11:32 am

SCHW: Dividend Analysis - The Charles Schwab Corporation
The Charles Schwab Corporation, a leader in the financial services sector, has consistently demonstrated a reliable dividend payment history with 37 years of continuity. Despite a moderate dividend yield of 1.09%, its willingness to maintain dividends with steady growth over the years is commendable. This highlights a commitment to returning value to shareholders.
📊 Overview
Evaluating the dividend profile of Charles Schwab reveals a structured approach to value distribution, marked by a substantial history devoid of significant interruptions or suspensions, thereby reinforcing investor confidence.
| Metric | Value |
|---|---|
| Sector | Financial Services |
| Dividend Yield | 1.09% |
| Current Dividend Per Share | 1.24 USD |
| Dividend History | 37 years |
| Last Cut/Suspension | None |
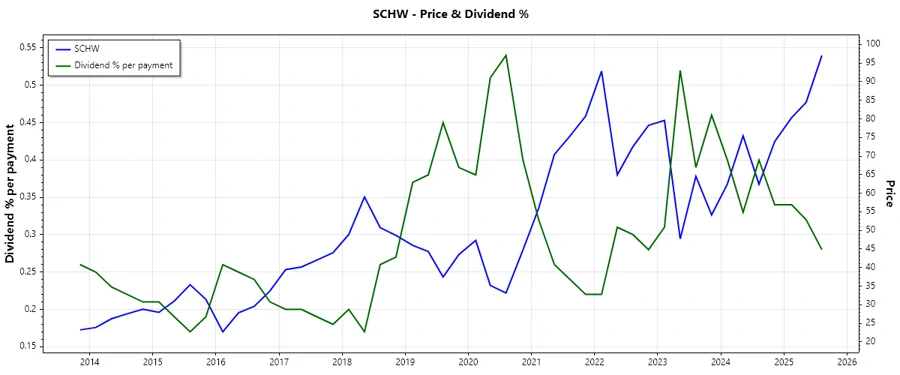
📈 Dividend History
Charles Schwab's robust dividend history underscores its stability and commitment to shareholder returns. A precise track record spanning decades reflects its resilient financial health.
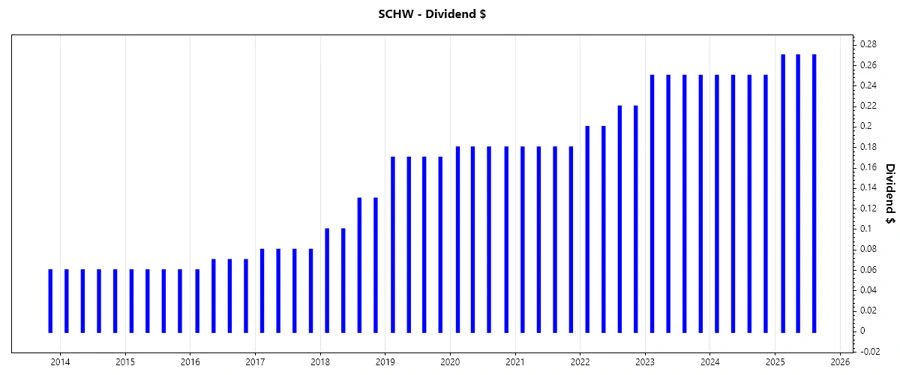
| Year | Dividend per Share (USD) |
|---|---|
| 2025 | 0.81 |
| 2024 | 1.00 |
| 2023 | 1.00 |
| 2022 | 0.84 |
| 2021 | 0.72 |
📈 Dividend Growth
The dividend growth of Charles Schwab Corporation, a pivotal indicator of its long-term sustainability, emphasizes a trajectory of moderate yet consistent upward adjustments, reinforcing investor expectations of future increases.
| Time | Growth % |
|---|---|
| 3 years | 11.57% |
| 5 years | 8.02% |
The average dividend growth is 8.02% over 5 years. This shows moderate but steady dividend growth.
🗣️ Payout Ratio
Payout ratios are crucial in assessing dividend sustainability. A balanced EPS payout of 31.05% indicates a prudent dividend policy supported by robust earnings, while a FCF payout of 13.15% suggests ample room to maintain payouts even under financial constraints.
| Key Figure | Ratio % |
|---|---|
| EPS-based | 31.05% |
| Free Cash Flow-based | 13.15% |
📊 Cashflow & Capital Efficiency
Cash flows are a testament to Charles Schwab's operational efficiency. High cash flow ratios imply effective management of operational activities, with a free cash flow to operating cash flow ratio of 76.78% showcasing flexibility and financial dexterity.
| 2024 | 2023 | 2022 |
|---|---|---|
| Free Cash Flow Yield: 1.51% | Free Cash Flow Yield: 15.05% | Free Cash Flow Yield: 0.69% |
| Earnings Yield: 4.39% | Earnings Yield: 4.04% | Earnings Yield: 4.58% |
| CAPEX to Operating Cash Flow: 23.22% | CAPEX to Operating Cash Flow: 3.57% | CAPEX to Operating Cash Flow: 47.20% |
| Stock-based Compensation to Revenue: 1.30% | Stock-based Compensation to Revenue: 1.25% | Stock-based Compensation to Revenue: 1.64% |
| FCF/Operating Cash Flow: 76.78% | FCF/Operating Cash Flow: 96.43% | FCF/Operating Cash Flow: 52.80% |
📊 Balance Sheet & Leverage Analysis
A company's balance sheet illuminates its capacity to maintain operations and meet its long-term obligations. The debt-to-equity ratio and financial leverage dictate leverage dynamics, with a net debt to EBITDA ratio illustrating debt service capabilities.
| 2024 | 2023 | 2022 |
|---|---|---|
| Debt-to-Equity: 0.93 | Debt-to-Equity: 1.44 | Debt-to-Equity: 1.03 |
| Debt-to-Assets: 0.09 | Debt-to-Assets: 0.12 | Debt-to-Assets: 0.07 |
| Debt-to-Capital: 0.48 | Debt-to-Capital: 0.59 | Debt-to-Capital: 0.51 |
| Net Debt to EBITDA: 0.33 | Net Debt to EBITDA: 2.04 | Net Debt to EBITDA: -0.22 |
| Current Ratio: 0.54 | Current Ratio: 0.54 | Current Ratio: 0.52 |
| Quick Ratio: 0.54 | Quick Ratio: 0.54 | Quick Ratio: 0.52 |
📊 Fundamental Strength & Profitability
Profitability metrics derive insights into the company's economic viability. The return on equity reflects stakeholder value creation, harmonizing with robust profit margins to exhibit financial strength.
| 2024 | 2023 | 2022 |
|---|---|---|
| Return on Equity: 12.28% | Return on Equity: 12.37% | Return on Equity: 19.62% |
| Return on Assets: 1.24% | Return on Assets: 1.03% | Return on Assets: 1.30% |
| Net Margin: 22.85% | Net Margin: 19.85% | Net Margin: 32.20% |
| EBIT Margin: 29.59% | EBIT Margin: 24.99% | EBIT Margin: 42.09% |
| EBITDA Margin: 35.11% | EBITDA Margin: 30.23% | EBITDA Margin: 47.68% |
| Gross Margin: 75.41% | Gross Margin: 73.81% | Gross Margin: 93.07% |
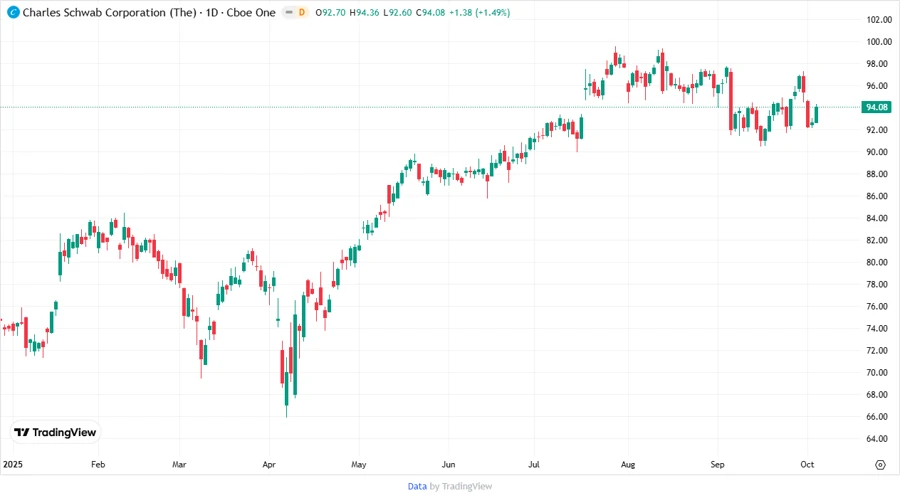
📈 Price Development
✅ Dividend Scoring System
| Criteria | Score | Score Bar |
|---|---|---|
| Dividend Yield | 3/5 | |
| Dividend Stability | 5/5 | |
| Dividend Growth | 4/5 | |
| Payout Ratio | 4/5 | |
| Financial Stability | 4/5 | |
| Dividend Continuity | 5/5 | |
| Cashflow Coverage | 4/5 | |
| Balance Sheet Quality | 4/5 |
Total Score: 33/40
⚠️ Rating
The Charles Schwab Corporation demonstrates robust dividends, buttressed by consistent growth and stability indicators, making it a commendable candidate for income-focused investment portfolios.
Smart Data Insight
Master the Perfect Entry & Exit for this Stock
Don't leave your profits to chance. Historically, this stock follows specific seasonal patterns that institutional traders use to maximize returns.
- ✅ Identify the "Golden Buying Window"
- ✅ Avoid high-risk correction cycles
- ✅ Backtested data from the last 20+ years