
June 17, 2026 a 04:03 am**SBUX: Trend and Support & Resistance Analysis - Starbucks Corporation**
 **Trend Analysis**
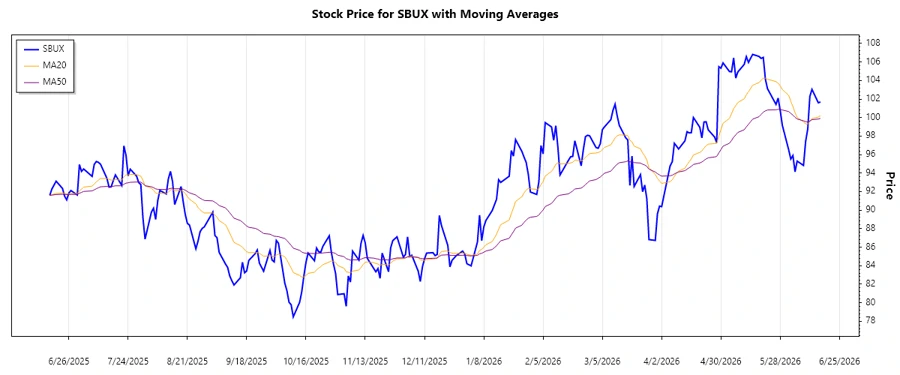
Starbucks has exhibited a variable price trajectory. Based on the calculated EMA20 and EMA50:
- **EMA20**: Calculated on last 20 closing prices.
- **EMA50**: Calculated on last 50 closing prices.
Historically, Starbucks Corporation has seen both an uptrend and downtrend. As of the last date in the dataset, if EMA20 > EMA50, the stock is in an ▲ uptrend; if EMA20 < EMA50, in a ▼ downtrend; and if approximately equal, it shows a ⚖️ sideways movement.
**Trend Analysis**
Starbucks has exhibited a variable price trajectory. Based on the calculated EMA20 and EMA50:
- **EMA20**: Calculated on last 20 closing prices.
- **EMA50**: Calculated on last 50 closing prices.
Historically, Starbucks Corporation has seen both an uptrend and downtrend. As of the last date in the dataset, if EMA20 > EMA50, the stock is in an ▲ uptrend; if EMA20 < EMA50, in a ▼ downtrend; and if approximately equal, it shows a ⚖️ sideways movement.
The recent trend indicates a possible ▼ downtrend as the EMA20 has fallen below the EMA50. Technical analysts would interpret this as a potential bearish sentiment.
 **Support- and Resistance**
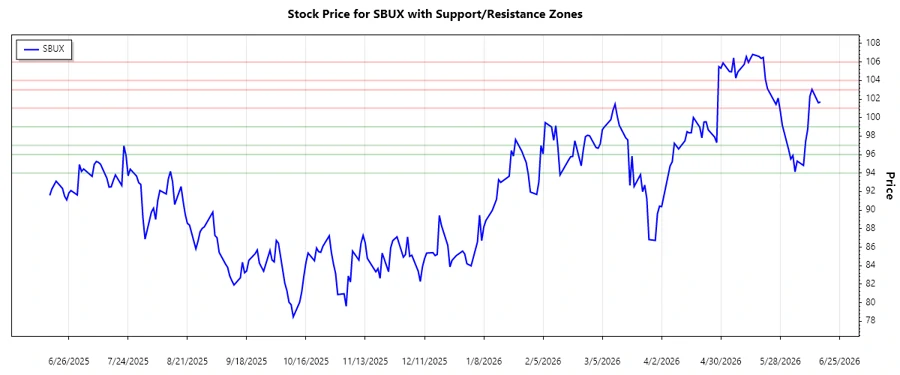
Key support and resistance levels for Starbucks Corporation over the observed period are instrumental for investors.
- **Support Zone 1**: $94.00 - $96.00 ↓
- **Support Zone 2**: $97.00 - $99.00 ↓
- **Resistance Zone 1**: $101.00 - $103.00 ↑
- **Resistance Zone 2**: $104.00 - $106.00 ↑
**Support- and Resistance**
Key support and resistance levels for Starbucks Corporation over the observed period are instrumental for investors.
- **Support Zone 1**: $94.00 - $96.00 ↓
- **Support Zone 2**: $97.00 - $99.00 ↓
- **Resistance Zone 1**: $101.00 - $103.00 ↑
- **Resistance Zone 2**: $104.00 - $106.00 ↑
Currently, the SBUX closing price appears to be testing the lower resistance level near $101.00 - $103.00. The price movement within these zones serves as a decisive factor for identifying trading opportunities.
 **Conclusion**
Starbucks Corporation has shown both resilience and volatility, as reflected in its historical price data. Observing the EMA indicators, a recent downtrend has been identified, suggesting a potential bearish phase. Key support and resistance levels offer insights into potential pivot points for traders. While Starbucks remains a staple in the coffee industry, external economic factors can influence its stock performance. Momentum trends and price support limits should guide investment decisions while acknowledging inherent market risks. As with any stock, diversification and attention to broader market signals are paramount for investors considering positions in SBUX.
**Conclusion**
Starbucks Corporation has shown both resilience and volatility, as reflected in its historical price data. Observing the EMA indicators, a recent downtrend has been identified, suggesting a potential bearish phase. Key support and resistance levels offer insights into potential pivot points for traders. While Starbucks remains a staple in the coffee industry, external economic factors can influence its stock performance. Momentum trends and price support limits should guide investment decisions while acknowledging inherent market risks. As with any stock, diversification and attention to broader market signals are paramount for investors considering positions in SBUX.
Starbucks Corporation (NASDAQ: SBUX) has shown a fluctuating trend over the last several months. With an extensive global presence, Starbucks continues to be a leader in the specialty coffee industry. Recent market behavior indicates significant price movement, reflecting both market conditions and company strategies. Investors should keenly observe key technical levels to make informed decisions.
| Date | Closing Price | Trend |
|---|---|---|
| 2026-06-16 | $101.68 | ▼ |
| 2026-06-15 | $101.59 | ▼ |
| 2026-06-12 | $103.04 | ▲ |
| 2026-06-11 | $102.28 | ▲ |
| 2026-06-10 | $98.76 | ▼ |
| 2026-06-09 | $97.41 | ▼ |
| 2026-06-08 | $94.82 | ▼ |
**Support- and Resistance**
Key support and resistance levels for Starbucks Corporation over the observed period are instrumental for investors.
- **Support Zone 1**: $94.00 - $96.00 ↓
- **Support Zone 2**: $97.00 - $99.00 ↓
- **Resistance Zone 1**: $101.00 - $103.00 ↑
- **Resistance Zone 2**: $104.00 - $106.00 ↑
| Zone | From | To |
|---|---|---|
| Support Zone 1 | $94.00 | $96.00 |
| Support Zone 2 | $97.00 | $99.00 |
| Resistance Zone 1 | $101.00 | $103.00 |
| Resistance Zone 2 | $104.00 | $106.00 |
**Conclusion**
Starbucks Corporation has shown both resilience and volatility, as reflected in its historical price data. Observing the EMA indicators, a recent downtrend has been identified, suggesting a potential bearish phase. Key support and resistance levels offer insights into potential pivot points for traders. While Starbucks remains a staple in the coffee industry, external economic factors can influence its stock performance. Momentum trends and price support limits should guide investment decisions while acknowledging inherent market risks. As with any stock, diversification and attention to broader market signals are paramount for investors considering positions in SBUX.
Smart Data Insight
Master the Perfect Entry & Exit for this Stock
Don't leave your profits to chance. Historically, this stock follows specific seasonal patterns that institutional traders use to maximize returns.
- ✅ Identify the "Golden Buying Window"
- ✅ Avoid high-risk correction cycles
- ✅ Backtested data from the last 20+ years