February 08, 2026 a 02:03 pm

SBUX: Trend and Support & Resistance Analysis - Starbucks Corporation
The recent performance of Starbucks Corporation's stock demonstrates a solid commitment to innovation and business expansion globally. Investors should be aware of emerging market potentials and risks tied to global supply chains. This analysis aims to encapsulate these dynamics through a detailed technical examination of the current market trend and core support and resistance levels.
Trend Analysis
| Date | Closing Price | Trend |
|---|---|---|
| 2026-02-06 | 99.45 | ▲ |
| 2026-02-05 | 96.07 | ▼ |
| 2026-02-04 | 96.97 | ▼ |
| 2026-02-03 | 93.04 | ▼ |
| 2026-02-02 | 91.69 | ▼ |
| 2026-01-30 | 91.95 | ▲ |
| 2026-01-29 | 93.88 | ▲ |
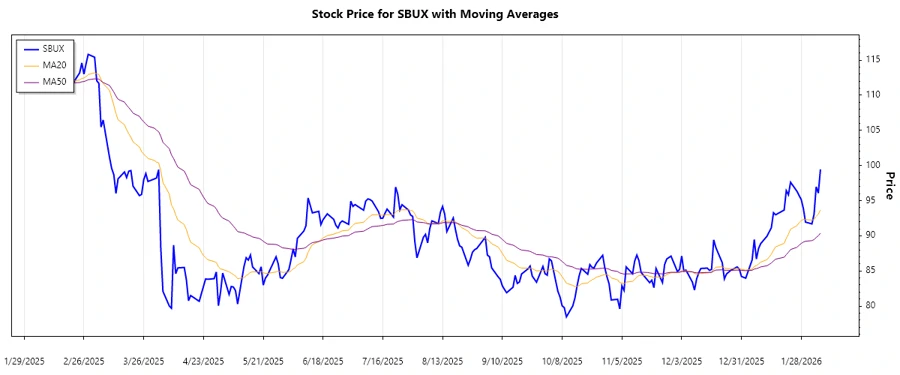
The trend analysis reveals mixed signals with short-term fluctuations, indicating potential volatility. The calculated EMA20 and EMA50 suggest a neutral to upward trend in recent sessions.
Support and Resistance
| Zone Type | From | To |
|---|---|---|
| Support 1 | 91.5 | 92.5 |
| Support 2 | 85.0 | 86.0 |
| Resistance 1 | 99.5 | 100.5 |
| Resistance 2 | 104.0 | 105.0 |
Currently, the stock is positioned slightly below the first resistance zone, testing the market's strength at this price level. If it breaches the resistance, it may indicate further upward movement.
Conclusion
Starbucks Corporation's stock presents a potentially rewarding investment opportunity, subject to current market volatilities. The technical analysis reflects an upward tilt with support from its expanding business sectors. However, challenges like global economic shifts and supply chain disruptions may pose risks. Analysts should consider these factors when projecting future stock performance.