November 18, 2025 a 02:04 pm
SBUX: Trend and Support & Resistance Analysis - Starbucks Corporation
Starbucks Corporation, globally renowned for its coffee and beverage offerings, has shown varied market movements in recent months. The company's extensive network of both company-operated and licensed stores under multiple brand names establishes it as a formidable player in the coffee retail sector. Recent price trends reveal key insights into its technical position, pivotal for investors assessing potential entry or exit points. The following analysis delves into recent trends, support, and resistance insights to highlight possible market directions for SBUX.
Trend Analysis
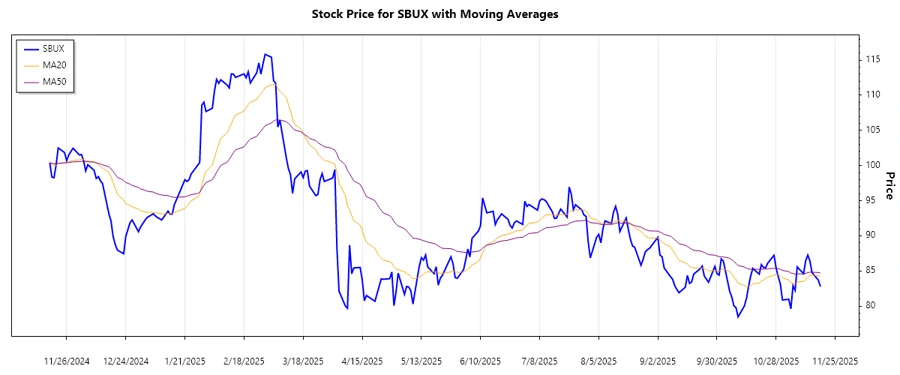
Recent market movements of Starbucks Corporation indicate a clear trend direction observable in the daily close price data. The EMA20 and EMA50 have been calculated to assess the prevailing trend.
| Date | Close Price | Trend |
|---|---|---|
| 2025-11-18 | 82.775 | ▼ |
| 2025-11-17 | 83.69 | ▼ |
| 2025-11-14 | 84.78 | ⚖️ |
| 2025-11-13 | 86.44 | ▲ |
| 2025-11-12 | 87.26 | ▲ |
| 2025-11-11 | 86.42 | ▲ |
| 2025-11-10 | 84.6 | ⚖️ |
Fazit: The recent data indicates a mix of trends with the most current trend direction showing slight bearish signals as the EMA20 is transitioning below EMA50. This highlights possible mid-term downside pressure.
Support and Resistance
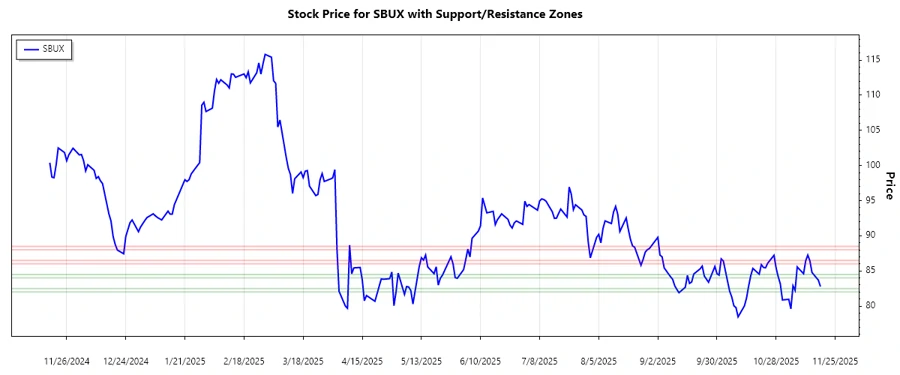
The following levels have been identified as key supports and resistances, critical in determining future movement floors or ceilings for Starbucks Corporation's stock price.
| Zone | Level | Direction |
|---|---|---|
| Support 1 | 82.00 - 82.50 | ⮝⮟ |
| Support 2 | 84.00 - 84.50 | ⮝⮟ |
| Resistance 1 | 86.00 - 86.50 | ⮟⮝ |
| Resistance 2 | 88.00 - 88.50 | ⮟⮝ |
Current Position: The price at around 82.78 indicates proximity to the lower support zone. Close monitoring is advised to anticipate potential rebounds or breaks below this level.
Fazit: The boundaries established here suggest identifiable zones where demand or supply may rise, crucial for investors to monitor these levels for strategic trade placement.
Conclusion
Starbucks Corporation shows a transitioning trend realm, with recent trading sessions reflecting cautious volatility. Opportunities arise within defined support levels for potential bullish reversals, while resistance zones suggest ceilings for further ascendancy. The mixed signals demand careful monitoring of moving averages, which provide hints at possible future bear actions unless bullish momentum resumes. Analysts should regard these levels critically to decide timely investment actions, acknowledging that Starbucks' diverse operational adequacy remains a robust consideration within its technical evaluation.
Smart Data Insight
Master the Perfect Entry & Exit for this Stock
Don't leave your profits to chance. Historically, this stock follows specific seasonal patterns that institutional traders use to maximize returns.
- ✅ Identify the "Golden Buying Window"
- ✅ Avoid high-risk correction cycles
- ✅ Backtested data from the last 20+ years