November 04, 2025 a 08:15 am

SBUX: Trend and Support & Resistance Analysis - Starbucks Corporation
Starbucks Corporation, a leading coffee retailer, has shown diverse segment growth, primarily in North America and internationally. However, the recent shift in its stock price indicates a need for cautious analysis amidst fluctuating market conditions. The stock's technical indicators presently offer insights into upcoming trends and potential market movements.
Trend Analysis
The stock price of Starbucks Corporation over the past few months has shown significant fluctuations. The calculation of the Exponential Moving Averages (EMAs) over 20 and 50 days reveals a shifting trend characteristic in recent days:
| Date | Close Price | Trend |
|---|---|---|
| 2025-11-03 | 80.96 | ▼ |
| 2025-10-31 | 80.87 | ▼ |
| 2025-10-30 | 83.15 | ▼ |
| 2025-10-29 | 84.17 | ▲ |
| 2025-10-28 | 85.43 | ▲ |
| 2025-10-27 | 87.22 | ▲ |
| 2025-10-24 | 86.09 | ▲ |
The recent data indicates a transition. As EMA20 crossed below EMA50, a short to medium-term downtrend has been identified, followed by minor upward movement signs.
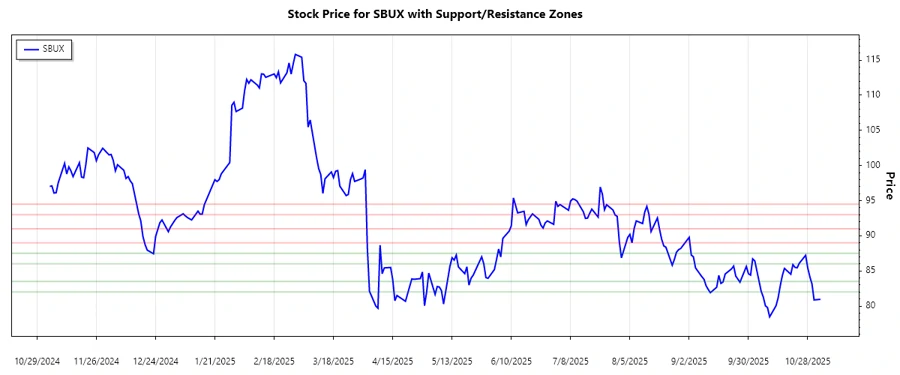
Support and Resistance
In technical analysis, support and resistance zones play crucial roles. For Starbucks Corporation, significant zones were calculated as follows:
| Zone Type | Range | Direction |
|---|---|---|
| Support | $82.00 - $83.50 | ▼ |
| Support | $86.00 - $87.50 | ▲ |
| Resistance | $89.00 - $91.00 | ▲ |
| Resistance | $93.00 - $94.50 | ▼ |
The current price leans within the support zone of $82.00 - $83.50, suggesting potential for a stabilization or rebound.
Conclusion
The technical evaluation for the Starbucks Corporation (SBUX) stock suggests a cautious approach moving forward. The recent slight downturn corroborated by the EMAs indicates a possible period of consolidation or minor rebound. However, potential upward breakouts from the support zones may present opportunities for a bullish sentiment if aligned with market conditions. Investors are advised to closely monitor price movements in proximity to established support/resistance levels to leverage potential trading avenues.
Smart Data Insight
Master the Perfect Entry & Exit for this Stock
Don't leave your profits to chance. Historically, this stock follows specific seasonal patterns that institutional traders use to maximize returns.
- ✅ Identify the "Golden Buying Window"
- ✅ Avoid high-risk correction cycles
- ✅ Backtested data from the last 20+ years