September 04, 2025 a 01:15 pm

SBUX: Trend and Support & Resistance Analysis - Starbucks Corporation
Starbucks Corporation has shown diverse movements over the past months. As a global entity in the coffee industry, the stock has experienced fluctuations affected by both international performance and new market developments. Recently, the market seems to be consolidating, with Endeavors in its international expansion likely impacting the current price dynamics.
Trend Analysis
The following data shows the most recent trends in the SBUX stock based on short-term and medium-term moving averages.
| Date | Close Price | Trend |
|---|---|---|
| 2025-09-03 | 87.25 | ▼ |
| 2025-09-02 | 89.78 | ▼ |
| 2025-08-29 | 88.19 | ▼ |
| 2025-08-28 | 88.02 | ▼ |
| 2025-08-27 | 87.66 | ▼ |
| 2025-08-26 | 86.63 | ▼ |
| 2025-08-25 | 85.81 | ▼ |
The current evaluation shows a consistent downward trend, indicated by the sustained declines across the EMA20 and EMA50 averages where EMA20 < EMA50 is persistently observed.
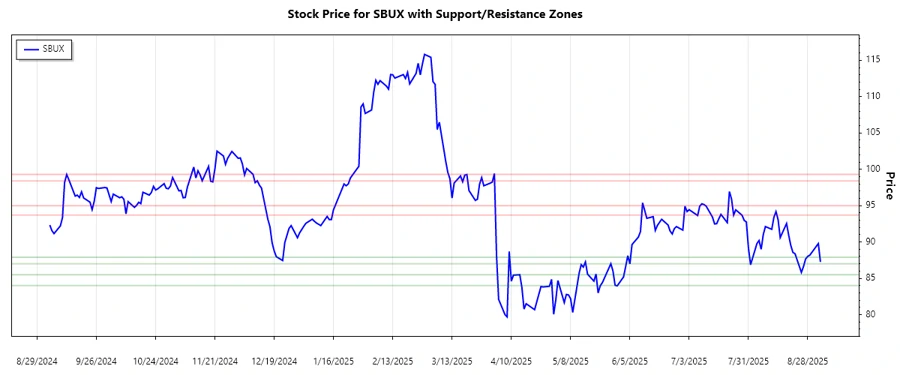
Support and Resistance
Identifying critical levels where Starbucks stock has shown behavior worth noting. These levels often function as dynamic support and resistance zones at which price can react significantly.
| Zone Type | From | To |
|---|---|---|
| Resistance ▲ | 93.70 | 95.00 |
| Resistance ▲ | 98.40 | 99.30 |
| Support ▼ | 87.00 | 87.90 |
| Support ▼ | 84.00 | 85.50 |
The current price is nearing the lower support zone, signaling watchfulness for potential reversal or continuation of current trends.
Conclusion
The Starbucks stock demonstrates a pressing contraction phase as prices challenge lower support zones with a prevailing bearish trend. While the company's international ventures bring uncertainties, they also open growth opportunities. However, analysts should carefully monitor Starbucks' operational reports, particularly in markets showing volatility, as they could pivot the current technical landscape either favorably or negatively.
Smart Data Insight
Master the Perfect Entry & Exit for this Stock
Don't leave your profits to chance. Historically, this stock follows specific seasonal patterns that institutional traders use to maximize returns.
- ✅ Identify the "Golden Buying Window"
- ✅ Avoid high-risk correction cycles
- ✅ Backtested data from the last 20+ years