
July 03, 2026 a 12:46 pm

SBUX: Dividend Analysis - Starbucks Corporation
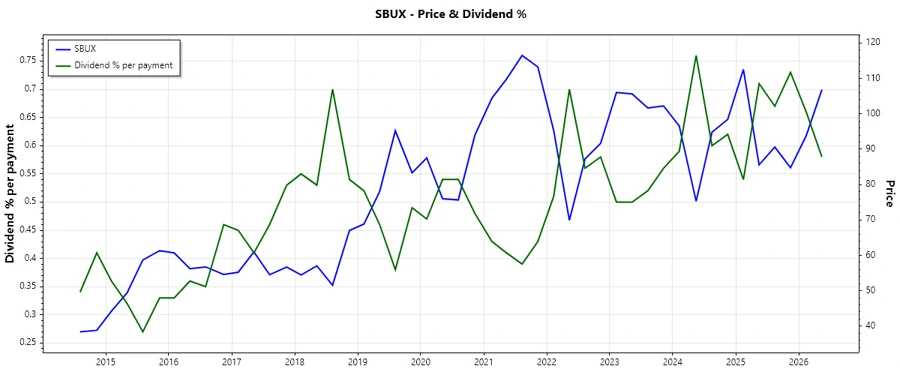
Starbucks Corporation demonstrates a strong commitment to shareholders through a consistent dividend policy. Despite some fluctuations in financial performance, the company maintains a stable dividend yield. Starbucks continues to be an attractive option for income-seeking investors, promising potential for sustainable returns.
📊 Overview
Starbucks operates within the competitive Consumer Discretionary sector. A dividend yield of 2.31% suggests a moderate level of return relative to its market price. With a current dividend of $2.43 and 17 years of dividend history, Starbucks showcases reliability in shareholder returns. Notably, there have been no recent dividend cuts or suspensions, maintaining investor confidence.
| Detail | Data |
|---|---|
| Sector | Consumer Discretionary |
| Dividend yield | 2.31 % |
| Current dividend per share | 2.43 USD |
| Dividend history | 17 years |
| Last cut or suspension | None |
📉 Dividend History
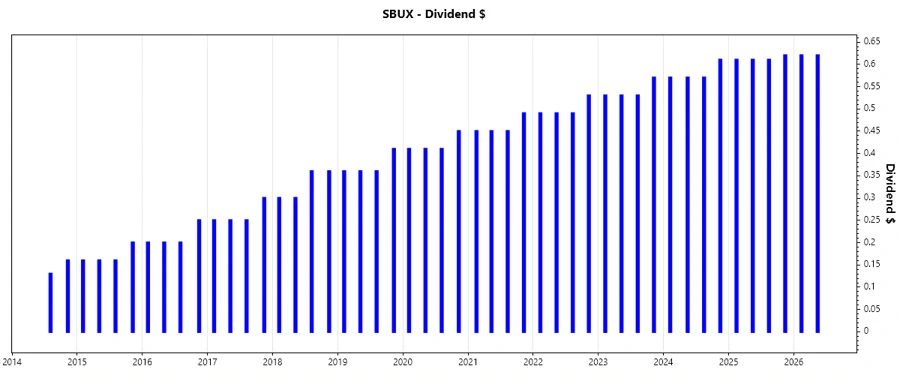
Starbucks' dividend history underscores its stable distribution strategy and shareholder value focus. The regularity and growth in dividends over the years reflect the company's financial strength and future outlook, a vital factor for any income-focused portfolio.
| Year | Dividend per Share |
|---|---|
| 2026 | 1.24 |
| 2025 | 2.45 |
| 2024 | 2.32 |
| 2023 | 2.16 |
| 2022 | 2.00 |
📈 Dividend Growth
Consistent dividend growth is crucial for long-term stockholder satisfaction and retention. Starbucks experienced average dividend growth rates in recent years, revealing its potential for increasing shareholder returns and demonstrating operational resilience.
| Time | Growth |
|---|---|
| 3 years | 7.00 % |
| 5 years | 7.84 % |
The average dividend growth is 7.84 % over 5 years. This shows moderate but steady dividend growth, indicating a commitment to returning capital to shareholders.
✅ Payout Ratio
The payout ratio, both EPS-based and FCF-based, is critical for assessing dividend sustainability. Starbucks' payout ratios highlight a focus on maintaining dividends amidst financial challenges. Investors must consider these metrics when evaluating income reliability.
| Key figure | Ratio |
|---|---|
| EPS-based | 185.24 % |
| Free cash flow-based | 101.66 % |
The EPS-based payout ratio of 185.24 % and FCF-based payout ratio of 101.66 % suggest a strained capacity for dividend coverage, reflecting the necessity of vigilant management of earnings and cash flow to sustain dividends long-term.
⚠️ Cashflow & Capital Efficiency
Assessing Starbucks' cashflow metrics is necessary to understand its financial health and efficiency in capital utilization. Consistent cash flow generation is pivotal for supporting ongoing operations and dividend payments.
| Year | 2023 | 2024 | 2025 |
|---|---|---|---|
| Free Cash Flow Yield | 2.29 % | 2.93 % | 2.50 % |
| Earnings Yield | 1.26 % | 3.39 % | 1.90 % |
| CAPEX to Operating Cash Flow | 37.27 % | 45.57 % | 48.56 % |
| Stock-based Compensation to Revenue | 0.74 % | 0.85 % | 0.86 % |
| Free Cash Flow / Operating Cash Flow Ratio | 51.44 % | 54.43 % | 51.44 % |
Overall, Starbucks exhibits reliable cash flow generation capabilities, albeit with potential areas for optimization in capital efficiency and cash flow usage.
⚖️ Balance Sheet & Leverage Analysis
A thorough examination of Starbucks' balance sheet indicators highlights its financial structure and capacity to manage and service debt. A strong balance sheet is key to sustaining growth and financial stability.
| Year | 2023 | 2024 | 2025 |
|---|---|---|---|
| Debt-to-Equity | -3.08 | -3.46 | -3.29 |
| Debt-to-Assets | 0.84 | 0.82 | 0.83 |
| Debt-to-Capital | 1.48 | 1.41 | 1.44 |
| Net Debt to EBITDA | 2.84 | 3.16 | 4.35 |
| Current Ratio | 0.78 | 0.75 | 0.72 |
| Quick Ratio | 0.59 | 0.56 | 0.51 |
| Financial Leverage | -3.68 | -4.21 | -3.95 |
Despite a strategically leveraged position, Starbucks should be vigilant to avoid potential risks associated with high debt, particularly in challenging financial climates.
🌟 Fundamental Strength & Profitability
Evaluating Starbucks' profitability metrics illuminates its effectiveness in generating earnings from its assets and equity. This evaluation is crucial for understanding long-term viability.
| Year | 2023 | 2024 | 2025 |
|---|---|---|---|
| Return on Equity | -51.59 % | -50.49 % | -22.93 % |
| Return on Assets | 14.01 % | 12.00 % | 5.80 % |
| Margins: Net | 11.46 % | 10.40 % | 4.99 % |
| Margins: EBIT | 16.54 % | 15.29 % | 9.93 % |
| Margins: EBITDA | 20.58 % | 19.69 % | 14.47 % |
| Margins: Gross | 27.37 % | 26.84 % | 24.15 % |
| Research & Development to Revenue | 0 % | 0 % | 0 % |
While Starbucks shows strong asset utilization, negative equity returns indicate challenges in maximizing shareholder equity value.
📈 Price Development
🔍 Dividend Scoring System
| Category | Score | |
|---|---|---|
| Dividend yield | 3 | |
| Dividend stability | 4 | |
| Dividend growth | 3 | |
| Payout ratio | 2 | |
| Financial stability | 3 | |
| Dividend continuity | 5 | |
| Cashflow Coverage | 2 | |
| Balance Sheet Quality | 2 |
Total Score: 24/40
🗳️ Rating
Starbucks Corporation holds a favorable position as a dividend-paying entity, thanks to its consistent dividend history and moderate yield. However, areas such as payout ratios and financial leverage caution against complacency. Investors seeking stable dividends with moderate growth potential may find Starbucks a fitting addition to their portfolios. Continued observation of its financial health and market conditions is advised to assess its capacity for sustaining and potentially raising dividends long term.
Smart Data Insight
Master the Perfect Entry & Exit for this Stock
Don't leave your profits to chance. Historically, this stock follows specific seasonal patterns that institutional traders use to maximize returns.
- ✅ Identify the "Golden Buying Window"
- ✅ Avoid high-risk correction cycles
- ✅ Backtested data from the last 20+ years