January 23, 2026 a 07:31 am

SBUX: Dividend Analysis - Starbucks Corporation
Starbucks Corporation has long stood as a beacon for consistent dividend growth and robust financial metrics. However, recent data suggests a mixed yet stable outlook due to emerging payout ratios. This analysis will delve into the specifics, revealing the nuances of its current financial state.
📊 Overview
Starbucks operates in a competitive sector where consistent dividends contribute to investor confidence. The company's dividend yield of 2.57% alongside a current dividend per share of 2.43 USD highlights its commitment to rewarding shareholders.
| Metric | Data |
|---|---|
| Sector | Consumer Discretionary |
| Dividend yield | 2.57% |
| Current dividend per share | 2.43 USD |
| Dividend history | 17 years |
| Last cut or suspension | None |
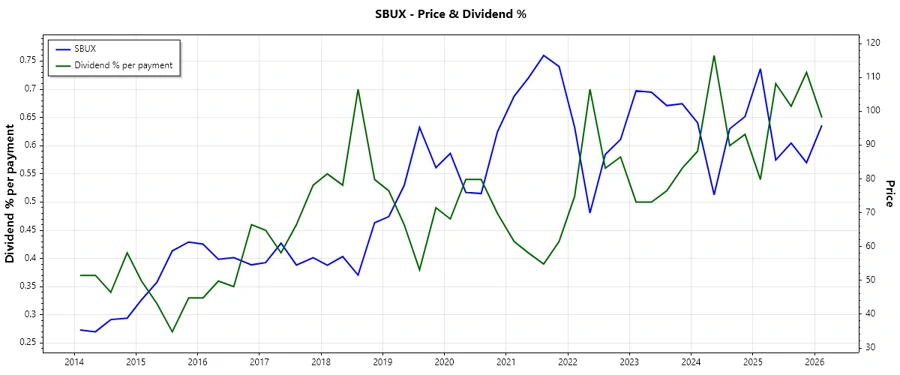
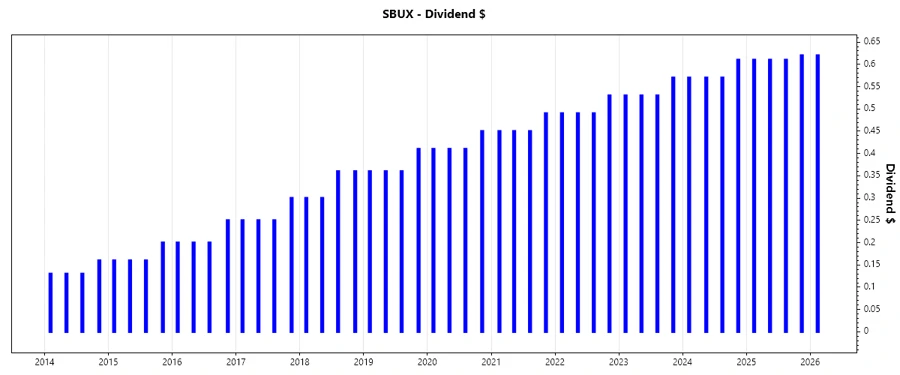
🏦 Dividend History
The stability of Starbucks's dividend history over 17 years without cuts is indicative of its operational and financial resilience, a critical factor in long-term investment strategies.
The chart underscores the consistent nature of Starbucks's dividend payments.
| Year | Dividend per Share (USD) |
|---|---|
| 2026 | 0.62 |
| 2025 | 2.45 |
| 2024 | 2.32 |
| 2023 | 2.16 |
| 2022 | 2.00 |
📈 Dividend Growth
Starbucks's dividend growth over the last 3 years at 6.99% and 5 years at 7.84% exemplifies a stable upward trend, reflecting strong corporate governance and growth strategies.
| Time | Growth |
|---|---|
| 3 years | 6.99% |
| 5 years | 7.83% |
The average dividend growth is 7.83% over 5 years. This shows moderate but steady dividend growth.
📉 Payout Ratio
Payout ratios are critical in assessing the sustainability of dividends. Starbucks has an EPS-based ratio of 149.43% and an FCF-based ratio of 113.22%, suggesting high payouts from earnings and cash flow, signaling a potential need for careful future financial management.
| Key Figure | Ratio |
|---|---|
| EPS-based | 149.43% |
| Free cash flow-based | 113.22% |
With the EPS-based ratio at 149.43% and FCF at 113.22%, the dividends are currently high, suggesting current payout levels are not fully covered by earnings and free cash flow.
💡 Cashflow & Capital Efficiency
Understanding Starbucks's cash flow and capital efficiency reveals insights into its operational health. Free cash flow yield and earnings yield are crucial indicators of cash availability and profitability.
| Year | 2025 | 2024 | 2023 |
|---|---|---|---|
| Free Cash Flow Yield | 2.50% | 2.99% | 3.51% |
| Earnings Yield | 1.90% | 3.39% | 3.94% |
| CAPEX to Operating Cash Flow | 48.56% | 45.57% | 38.84% |
| Stock-based Compensation to Revenue | 0.86% | 0.85% | 0.84% |
| Free Cash Flow / Operating Cash Flow Ratio | 51.44% | 54.43% | 61.16% |
The data indicates modest free cash flow yields and earnings yields, warranting caution in cash conservation strategies.
📊 Balance Sheet & Leverage Analysis
The balance sheet and leverage metrics underscore financial robustness or vulnerabilities. Key ratios like Debt-to-Equity inform about leverage, essential for evaluating financial risk and capacity.
| Year | 2025 | 2024 | 2023 |
|---|---|---|---|
| Debt-to-Equity | -3.29 | -3.46 | -3.08 |
| Debt-to-Assets | 83.11% | 82.33% | 83.54% |
| Debt-to-Capital | 143.73% | 140.58% | 148.15% |
| Net Debt to EBITDA | 4.35 | 3.16 | 2.84 |
| Current Ratio | 0.723 | 0.755 | 0.782 |
| Quick Ratio | 0.509 | 0.559 | 0.588 |
| Financial Leverage | -3.95 | -4.21 | -3.68 |
High leverage ratios highlight the need for cautious debt management strategies, presenting a challenge to long-term fiscal sustainability.
🗣️ Fundamental Strength & Profitability
Assessing fundamental metrics provides an insight into the company's core financial health. Metrics like Return on Assets and Margins are vital for discerning operational efficiency.
| Year | 2025 | 2024 | 2023 |
|---|---|---|---|
| Return on Equity | -22.93% | -50.49% | -51.59% |
| Return on Assets | 5.80% | 12.00% | 14.01% |
| Margins: Net | 4.99% | 10.40% | 11.46% |
| Margins: EBIT | 9.93% | 15.29% | 16.54% |
| Margins: EBITDA | 14.47% | 19.69% | 20.58% |
| Margins: Gross | 24.15% | 26.84% | 27.37% |
| Research & Development to Revenue | 0% | 0% | 0% |
While profitability metrics are encouraging, a negative Return on Equity requires strategic redirection to improve shareholder value.
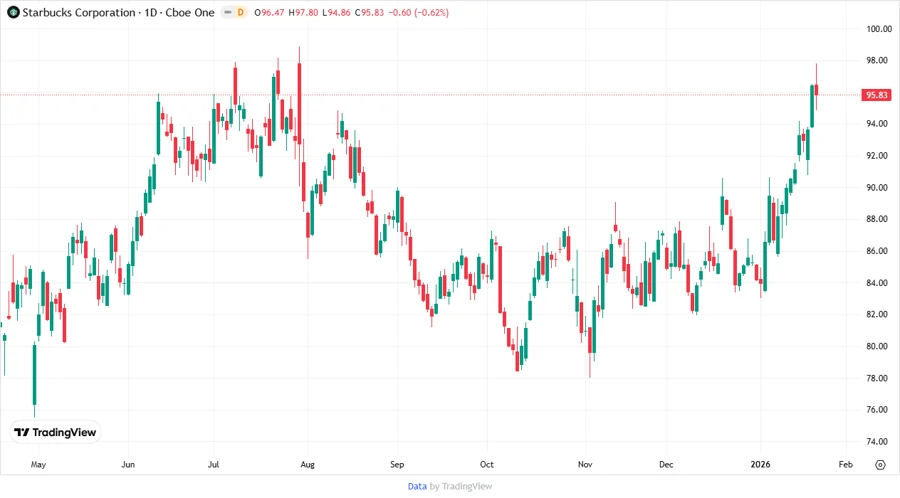
📈 Price Development
✅ Dividend Scoring System
| Category | Score | Indicator |
|---|---|---|
| Dividend yield | 4 | |
| Dividend Stability | 5 | |
| Dividend growth | 4 | |
| Payout ratio | 2 | |
| Financial stability | 3 | |
| Dividend continuity | 5 | |
| Cashflow Coverage | 3 | |
| Balance Sheet Quality | 3 |
Total Score: 29/40
🏁 Rating
Starbucks Corporation presents a robust model with consistently stable dividends and impressive historical growth. While caution is advised due to leveraged positioning and high payout ratios, the company's strategic foresight promises long-term sustainability and growth. Investors may find this stock a valuable addition, aligning with dividend-focused portfolios.