October 25, 2025 a 03:31 am

SBUX: Dividend Analysis - Starbucks Corporation
Starbucks Corporation, a leader in the coffee industry, has been a reliable dividend-paying entity for the past 16 years. Despite current economic challenges, Starbucks maintains its commitment to share profits with its shareholders. However, investors should be aware of the company's high payout ratios, which might impact its future dividend growth strategies. Let’s delve into the details of its dividend profile to gain a deeper understanding.
📊 Overview
| Metric | Value |
|---|---|
| Sector | Consumer Cyclical |
| Dividend Yield | 2.85% |
| Current Dividend Per Share | 2.27 USD |
| Dividend History | 16 years |
| Last Cut or Suspension | None |
The given dividend indicators provide insights into Starbucks' capability to continue rewarding its shareholders. A dividend yield of 2.85% is reasonable and indicates the company’s income-generating potential for investors.
📈 Dividend History
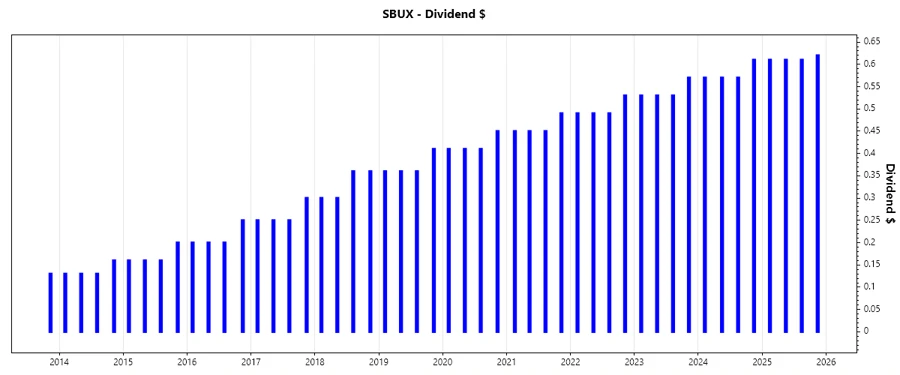
The historical trend of dividends provides a perspective on the company's commitment to consistent wealth distribution among shareholders. Starbucks' 16-year unbroken dividend history demonstrates its resilience and success in creating shareholder value, solidifying its reputation as a dependable income stock.
| Year | Dividend Per Share (USD) |
|---|---|
| 2025 | 2.45 |
| 2024 | 2.32 |
| 2023 | 2.16 |
| 2022 | 2.00 |
| 2021 | 1.84 |
📈 Dividend Growth
Dividend growth is a critical measure of a company’s ability to increase payouts over time. Starbucks has shown steady dividend growth over the past years, reflecting its solid operating performance and commitment to return value to its shareholders.
| Time | Growth |
|---|---|
| 3 years | 8.03% |
| 5 years | 9.26% |
The average dividend growth is 9.26% over 5 years. This shows moderate but steady dividend growth, bolstering shareholders’ confidence in the future income potential.
📉 Payout Ratio
Payout ratios are essential to understanding whether a company's earnings or cash flow can sustain its dividend payments. Starbucks' high payout ratios present a risk to future dividend sustainability if earnings growth does not keep pace.
| Key Figure | Ratio |
|---|---|
| EPS-based | 98.12% |
| Free Cash Flow-based | 114.64% |
The EPS-based payout ratio is 98.12%, signaling that nearly all of Starbucks' earnings are returned to shareholders as dividends, a potentially concerning figure if earnings growth stalls. The FCF-based payout ratio exceeds ideal levels, further emphasizing the dependency on cash flow strength.
✅ Cashflow & Capital Efficiency
Cash flow metrics are vital indicators of a company's financial health, impacting both its dividend policies and operational sustainability. They measure the efficiency with which a company uses its capital to generate returns for investors.
| Year | 2024 | 2023 | 2022 |
|---|---|---|---|
| Free Cash Flow Yield | 2.99% | 3.52% | 2.59% |
| Earnings Yield | 3.39% | 3.95% | 3.32% |
| CAPEX to Operating Cash Flow | 45.57% | 38.84% | 41.87% |
| Stock-based Compensation to Revenue | 0.85% | 0.84% | 0.84% |
| Free Cash Flow / Operating Cash Flow Ratio | 54.43% | 61.16% | 58.13% |
The stability and growth in free cash flow yield and earnings yield reflect Starbucks' capability to meet its obligations and support capital expenditures from its operating cash flow, critical for sustaining dividends.
⚠️ Balance Sheet & Leverage Analysis
Leverage and liquidity ratios provide insight into a company's financial structure and risk. A well-managed balance sheet is crucial for maintaining investor confidence and operational flexibility.
| Year | 2024 | 2023 | 2022 |
|---|---|---|---|
| Debt-to-Equity | -3.46 | -3.08 | -2.73 |
| Debt-to-Assets | 0.82 | 0.84 | 0.85 |
| Debt-to-Capital | 1.41 | 1.48 | 1.58 |
| Net Debt to EBITDA | 3.16 | 2.84 | 3.36 |
| Current Ratio | 0.75 | 0.78 | 0.77 |
| Quick Ratio | 0.56 | 0.59 | 0.53 |
| Financial Leverage | -4.20 | -3.68 | -3.21 |
While the debt levels appear high, indicating significant leverage, the consistent interest coverage ratio suggests that Starbucks can comfortably meet its interest obligations, crucial for financial stability.
🗣️ Fundamental Strength & Profitability
Strong fundamentals and profitability indicate a company's ability to effectively convert invested capital into profits, reflecting operational efficiency and a competitive advantage in its industry.
| Year | 2024 | 2023 | 2022 |
|---|---|---|---|
| Return on Equity | -50.49% | -51.59% | -37.69% |
| Return on Assets | 12.00% | 14.01% | 11.73% |
| Margins: Net | 10.39% | 11.46% | 10.18% |
| Margins: EBIT | 15.29% | 16.54% | 14.62% |
| Margins: EBITDA | 19.69% | 20.58% | 19.36% |
| Margins: Gross | 26.84% | 27.37% | 25.96% |
| Research & Development to Revenue | 0% | 0% | 0% |
Despite negative return on equity, Starbucks maintains profitability across key margins, reflecting efficiency in cost management and solid revenue growth potential. The lack of R&D investment might limit future innovation and competitive edge.
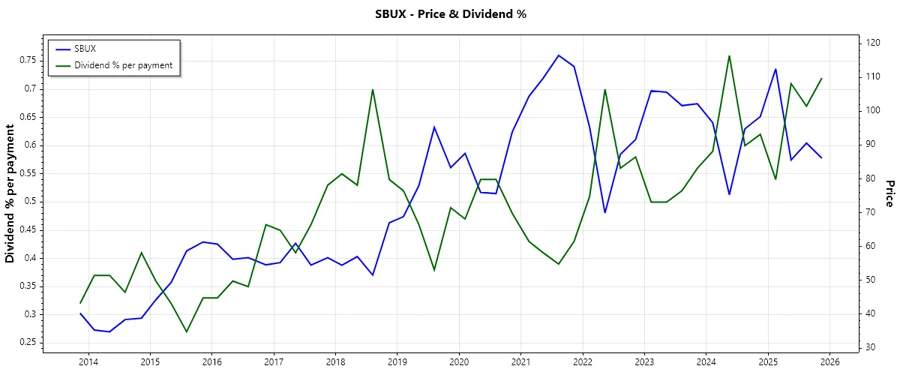
📈 Price Development
✅ Dividend Scoring System
| Criteria | Score Description | Score (1-5) |
|---|---|---|
| Dividend Yield | Strong and competitive yield | |
| Dividend Stability | 16 years of consistent dividends | |
| Dividend Growth | Steady historical growth | |
| Payout Ratio | High ratio, potential risk | |
| Financial Stability | Good interest coverage but high debt | |
| Dividend Continuity | Not cut or suspended in recent years | |
| Cashflow Coverage | Strong cashflow generation | |
| Balance Sheet Quality | High leverage, moderate risk |
Total Score: 33/40
🔍 Rating
Starbucks Corporation demonstrates a robust dividend profile through consistent payments and growth. However, its high payout and leverage ratios suggest a need for cautious monitoring. The company's current financial health supports its dividend strategy, but shareholders should remain vigilant about potential financial metric shifts. Overall, Starbucks remains a sound choice for investors seeking moderate income and exposure to the consumer cyclicals sector with a resiliency in dividend payout.