July 30, 2025 a 12:47 pm

SBUX: Dividend Analysis - Starbucks Corporation
Starbucks Corporation, a leader in the global coffeehouse industry, exhibits a solid dividend profile with a steady payout history. Despite some fluctuations in earnings, the company's consistent dividend growth and stable yield make it a reliable choice for income investors. However, investors should be aware of its high payout ratio which might impact future dividend growth. Overall, Starbucks offers a promising dividend strategy if backed by careful financial management.
📊 Overview
Starbucks operates in the consumer discretionary sector and has developed a well-regarded history in delivering dividends. The company's current dividend yield stands at 2.62%, with a dividend per share of 2.27 USD. Its dividend history spans 16 years, with no recent cuts or suspensions.
| Sector | Dividend yield | Current dividend per share | Dividend history | Last cut or suspension |
|---|---|---|---|---|
| Consumer Discretionary | 2.62 % | 2.27 USD | 16 years | None |
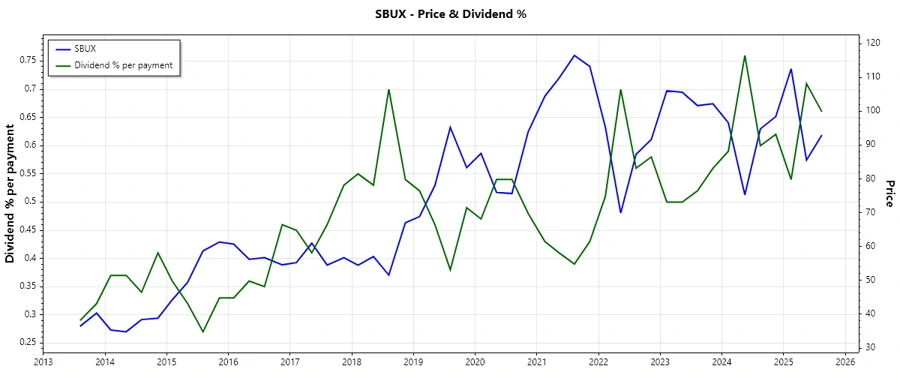
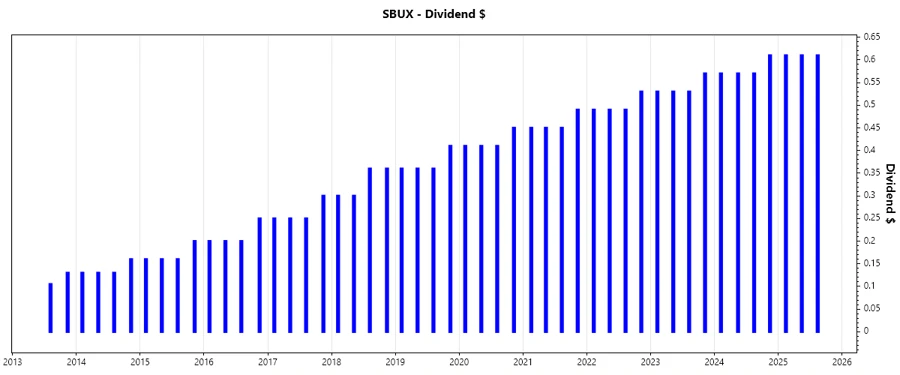
📈 Dividend History
The dividend history of Starbucks highlights its commitment to rewarding shareholders, showcasing a consistent upward trend in dividend payments. This denotes the company's robust financial health and its emphasis on returning value to shareholders. Such stability is crucial for investors focused on long-term income from dividends.
| Year | Dividend per share |
|---|---|
| 2025 | 1.83 USD |
| 2024 | 2.32 USD |
| 2023 | 2.16 USD |
| 2022 | 2.00 USD |
| 2021 | 1.84 USD |
📉 Dividend Growth
Starbucks has demonstrated a consistent increase in dividend payouts over the years, reflecting its growth strategy and financial strength. The growth rate over the past 3 years is 8.03%, while the 5-year rate is 9.26%, marking steady dividend growth.
| Time | Growth |
|---|---|
| 3 years | 8.03 % |
| 5 years | 9.26 % |
The average dividend growth is 9.26% over 5 years. This shows moderate but steady dividend growth.
⚠️ Payout Ratio
The payout ratio is a key indicator of a company's ability to maintain dividend payments. Starbucks has an EPS-based payout ratio of 82.52% and a free cash flow-based payout ratio of 93.41%. These figures suggest the dividends are relatively high compared to earnings and cash flows, which could limit future dividend increases if trends do not improve.
| Key figure | Ratio |
|---|---|
| EPS-based | 82.52 % |
| Free cash flow-based | 93.41 % |
Cashflow & Capital Efficiency
Cash flow management is integral to sustainability and growth, particularly for dividend payments. An analysis reveals that Starbucks maintains a free cash flow yield of approximately 2.62%. Its capital expenditure to operating cash flow ratio is 50.35%, indicating significant reinvestment in its operations.
| Metric | 2024 | 2023 | 2022 |
|---|---|---|---|
| Free Cash Flow Yield | 2.99 % | 3.52 % | 2.59 % |
| Earnings Yield | 3.39 % | 3.95 % | 3.32 % |
| CAPEX to Operating Cash Flow | 45.57 % | 38.84 % | 41.87 % |
| Stock-based Compensation to Revenue | 0.85 % | 0.84 % | 0.84 % |
| Free Cash Flow / Operating Cash Flow Ratio | 54.43 % | 61.16 % | 58.13 % |
The stable cash flow and efficient capital allocation signify robust financial health, promoting confidence in sustained dividend distributions.
Balance Sheet & Leverage Analysis
A solid balance sheet underpins financial resilience and dividend continuity. Starbucks shows high leverage, with a debt-to-equity ratio of -3.46, indicating higher debt than equity, and a net debt to EBITDA ratio of 3.68, suggesting moderate leverage risks.
| Metric | 2024 | 2023 | 2022 |
|---|---|---|---|
| Debt-to-Equity | -3.46 | -3.08 | -2.73 |
| Debt-to-Assets | 82.33 % | 83.54 % | 85.08 % |
| Debt-to-Capital | 140.58 % | 148.15 % | 157.67 % |
| Net Debt to EBITDA | 3.16 | 2.84 | 3.36 |
| Current Ratio | 0.64 | 0.78 | 0.77 |
| Quick Ratio | 0.56 | 0.59 | 0.53 |
| Financial Leverage | -4.21 | -3.68 | -3.21 |
The leverage metrics imply potential financial vulnerability, but consistent profitability and solid operational performance may offset these risks.
Fundamental Strength & Profitability
Fundamental strength is a barometer for long-term sustainability. While Starbucks exhibits negative return on equity due to prior losses, profit margins remain solid with a strong EBIT margin.
| Metric | 2024 | 2023 | 2022 |
|---|---|---|---|
| Return on Equity | -50.49 % | -51.59 % | -37.69 % |
| Return on Assets | 12.00 % | 14.01 % | 11.73 % |
| Margins: Net | 10.40 % | 11.46 % | 10.18 % |
| EBIT Margin | 15.29 % | 16.54 % | 14.62 % |
| EBITDA Margin | 19.69 % | 20.58 % | 19.36 % |
| Gross Margin | 26.84 % | 27.37 % | 25.96 % |
| R&D to Revenue | 0 % | 0 % | 0 % |
Solid profit margins align with Starbucks' strategic growth initiatives and operational efficiency, underscoring long-term investment viability.
Price Development
✅ Dividend Scoring System
| Criterion | Score | Score Bar |
|---|---|---|
| Dividend Yield | 3 | |
| Dividend Stability | 4 | |
| Dividend Growth | 4 | |
| Payout Ratio | 2 | |
| Financial Stability | 3 | |
| Dividend Continuity | 4 | |
| Cashflow Coverage | 3 | |
| Balance Sheet Quality | 2 |
Overall Score: 25 out of 40
🗣️ Rating
Starbucks Corporation places itself as a viable dividend-paying company with notable growth and consistent yields. However, the high payout ratios coupled with leveraged financials call for a cautious approach. For dividend-oriented investors, maintaining an eye on corporate developments, especially around debt metrics and cash flow stability, should be prioritized. Overall, Starbucks is a reputable dividend contender with moderate challenges.
Smart Data Insight
Master the Perfect Entry & Exit for this Stock
Don't leave your profits to chance. Historically, this stock follows specific seasonal patterns that institutional traders use to maximize returns.
- ✅ Identify the "Golden Buying Window"
- ✅ Avoid high-risk correction cycles
- ✅ Backtested data from the last 20+ years