May 01, 2025 a 02:46 am


SBUX: Dividend Analysis - Starbucks Corporation
Starbucks Corporation continues to present a robust dividend profile with a history of consistent payouts. Despite a debt-heavy balance sheet, the company's cash flow management and dividend growth indicate a firm commitment to shareholder returns. However, high payout ratios suggest limited room for further dividend expansion without underlying earnings growth or improved free cash flow.
Overview 📊
Starbucks operates in the consumer discretionary sector, with a notable emphasis on shareholder value through dividends. It boasts a dividend yield of 2.998% and a current dividend per share of $2.27, a testimony to its steady dividend policy over 16 years. Notably, the company has not cut or suspended dividends recently.
| Metric | Details |
|---|---|
| Sector | Consumer Discretionary |
| Dividend yield | 2.998% |
| Current dividend per share | $2.27 |
| Dividend history | 16 years |
| Last cut or suspension | None |
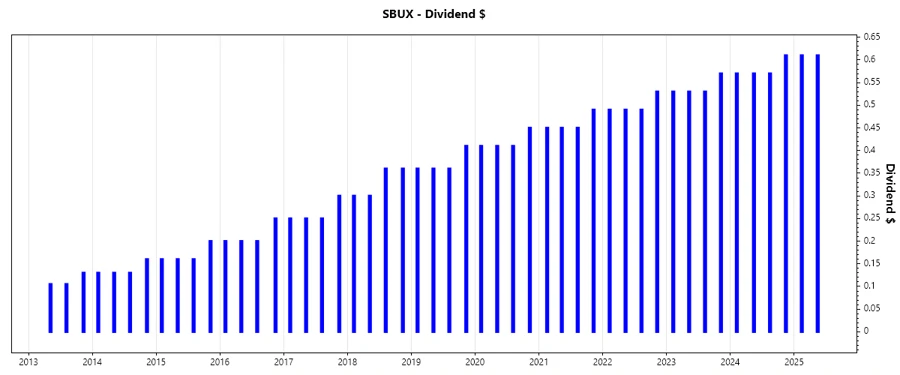
Dividend History 📉
Starbucks has a proven track record of increasing dividends, reflecting its profitability and stable cash flows. This consistency is crucial for income-focused investors seeking reliability in cash distributions.
| Year | Dividend Per Share |
|---|---|
| 2025 | $1.22 |
| 2024 | $2.32 |
| 2023 | $2.16 |
| 2022 | $2.00 |
| 2021 | $1.84 |
Dividend Growth 📈
The company's dividend growth over recent years indicates moderate improvement, enhancing income for investors. Maintaining a growth of 8.03% over three years and 9.26% over five years shows strategic reinvestment in operations and fulfillment of shareholder expectations.
| Time | Growth |
|---|---|
| 3 years | 8.03% |
| 5 years | 9.26% |
The average dividend growth is 9.26% over 5 years. This shows moderate but steady dividend growth.
Payout Ratio ✅
An effective payout ratio is vital to assess dividend sustainability. Starbucks's EPS-based payout ratio is 82.52%, and the free cash flow-based ratio stands at 88.75%. These ratios highlight a high payout trend, leaving limited headroom to increase dividends without compromising reinvestment potential.
| Key figure | Ratio |
|---|---|
| EPS-based | 82.52% |
| Free cash flow-based | 88.75% |
Cashflow & Capital Efficiency ⚠️
Starbucks demonstrates robust cash flow management with a free cash flow yield of 3.20% and an earnings yield of 3.44%. Its CAPEX to operating cash flow ratio is healthy, indicating good reinvestment capabilities. However, the ratio of stock-based compensation to revenue and the free cash flow to operating cash flow ratio reveal areas for operational efficiency improvement.
| Metric | 2024 | 2023 | 2022 |
|---|---|---|---|
| Free Cash Flow Yield | 3.20% | 3.52% | 2.59% |
| Earnings Yield | 3.39% | 3.95% | 3.32% |
| CAPEX to Operating Cash Flow | 45.57% | 38.84% | 41.87% |
| Stock-based Compensation to Revenue | 0.85% | 0.84% | 0.84% |
| Free Cash Flow / Operating Cash Flow Ratio | 54.43% | 61.16% | 58.13% |
Balance Sheet & Leverage Analysis 🗣️
Starbucks’s leverage ratios indicate high debt levels, with negative equity, signaling financial leveraging. While the current and quick ratios suggest liquidity challenges, the interest coverage ratio remains above average, inferring ability to meet debt obligations.
| Metric | 2024 | 2023 | 2022 |
|---|---|---|---|
| Debt-to-Equity | -3.46 | -3.08 | -2.73 |
| Debt-to-Assets | 82.33% | 83.54% | 85.08% |
| Debt-to-Capital | 140.58% | 148.15% | 157.67% |
| Net Debt to EBITDA | 3.16 | 2.84 | 3.36 |
| Current Ratio | 0.75 | 0.78 | 0.77 |
| Quick Ratio | 0.56 | 0.59 | 0.53 |
Fundamental Strength & Profitability 🏦
Despite negative equity returns, Starbucks's profitability margins such as net, EBIT, and EBITDA margins showcase a resilient core business model. The absence of R&D expenses to revenue and relatively stable asset returns signify a consolidated market approach.
| Metric | 2024 | 2023 | 2022 |
|---|---|---|---|
| Return on Equity | -50.49% | -51.59% | -37.69% |
| Return on Assets | 12.00% | 14.01% | 11.73% |
| Net Margin | 10.40% | 11.46% | 10.18% |
| Gross Margin | 26.84% | 27.37% | 25.96% |
| EBIT Margin | 15.29% | 16.54% | 14.62% |
| EBITDA Margin | 19.69% | 20.58% | 19.36% |
Price Development 📈
Dividend Scoring System 📏
| Criteria | Score (1-5) | Score Bar |
|---|---|---|
| Dividend yield | 3 | |
| Dividend Stability | 5 | |
| Dividend growth | 4 | |
| Payout ratio | 2 | |
| Financial stability | 3 | |
| Dividend continuity | 5 | |
| Cashflow Coverage | 4 | |
| Balance Sheet Quality | 2 |
Total Score: 28/40
Rating ⭐
Starbucks Corporation maintains a strong dividend policy bolstered by a history of stability and growth. While its high debt levels pose some risks, its effective cash flow management and strong market position suggest sustainability. Investors inclined toward income should weigh these strengths against potential balance sheet vulnerabilities.
Smart Data Insight
Master the Perfect Entry & Exit for this Stock
Don't leave your profits to chance. Historically, this stock follows specific seasonal patterns that institutional traders use to maximize returns.
- ✅ Identify the "Golden Buying Window"
- ✅ Avoid high-risk correction cycles
- ✅ Backtested data from the last 20+ years