February 28, 2026 a 03:31 am

SBAC: Dividend Analysis - SBA Communications Corporation
SBA Communications Corporation presents an intriguing dividend profile within the telecommunications infrastructure sector. With a dividend yield of approximately 2.28%, the company has shown reasonable consistency in its dividend history over the past eight years. Despite market challenges, its current financial strategies highlight a robust ability to sustain dividend payments. The combination of steady dividend growth and careful financial management indicates potential for continued shareholder returns.
📊 Overview
The analysis provides insights into SBA Communications Corporation's (SBAC) dividend profile and financial health.
| Attribute | Detail |
|---|---|
| Sector | Telecommunications & Infrastructure |
| Dividend Yield | 2.28% |
| Current Dividend per Share | $4.47 USD |
| Dividend History | 8 years |
| Last Cut or Suspension | None |
🗣️ Dividend History
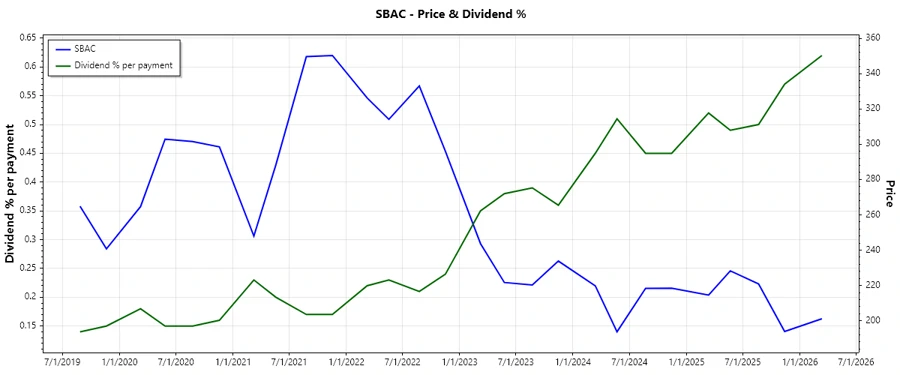
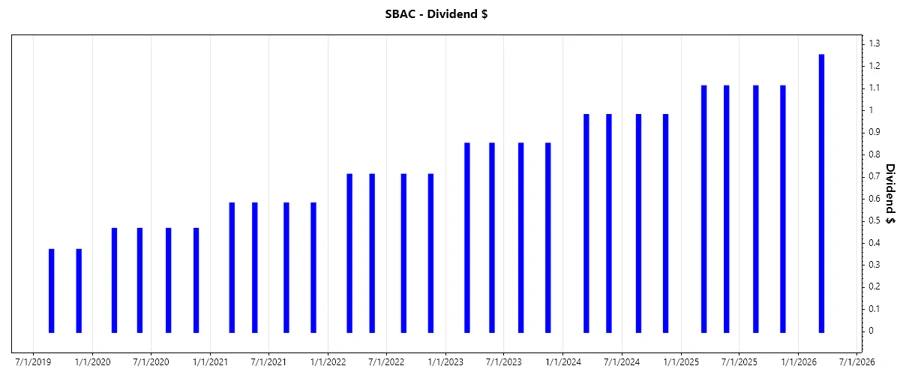
Analyzing SBA Communications Corporation’s dividend history reveals its commitment to returning value to shareholders. The company has maintained or increased its dividend payments consistently over recent years. This stability is a testament to the company’s solid business model and financial prudence, making it an attractive option for dividend investors.
| Year | Dividend per Share (USD) |
|---|---|
| 2026 | $1.25 |
| 2025 | $4.44 |
| 2024 | $3.92 |
| 2023 | $3.40 |
| 2022 | $2.84 |
📈 Dividend Growth
Monitoring dividend growth is crucial as it highlights a company's ability to increase returns to investors over time. SBA Communications Corporation has demonstrated consistent growth in dividends, with a three-year growth rate at 16.06% and a five-year growth rate at 19.01%, indicating moderate yet reliable increase and potential for future payouts.
| Time | Growth |
|---|---|
| 3 years | 16.06% |
| 5 years | 19.01% |
The average dividend growth is 19.01% over 5 years. This shows moderate but steady dividend growth.
📉 Payout Ratio
Payout ratios provide insights into how much of a company's earnings are being distributed to shareholders as dividends, reflecting financial health and sustainability. SBA Communications Corporation maintains an EPS-based payout ratio of 45.08% and a free cash flow (FCF)-based payout ratio of 44.64%. These figures indicate a balanced approach, allowing room for reinvestment while rewarding shareholders.
| Key figure | Ratio |
|---|---|
| EPS-based | 45.08% |
| Free cash flow-based | 44.64% |
These payout ratios are healthy, indicating a sustainable dividend strategy while maintaining flexibility for future growth investments.
✅ Cashflow & Capex Efficiency
Cash flow stability and capital efficiency are vital for sustaining dividend payouts and ensuring financial flexibility. Examining free cash flow yield, earnings yield, and capital expenditures (CAPEX) relative to operating cash flow helps assess efficiency. Despite challenges, SBAC's metrics indicate solid cash flow management and strategic capital allocation.
| Year | 2025 | 2024 | 2023 |
|---|---|---|---|
| Free Cash Flow Yield | 5.14% | 5.03% | 4.74% |
| Earnings Yield | 5.08% | 3.41% | 1.82% |
| CAPEX to Operating Cash Flow | 17.41% | 17.09% | 15.33% |
| Stock-based Compensation to Revenue | 2.69% | 2.78% | 3.24% |
| Free Cash Flow / Operating Cash Flow Ratio | 82.59% | 82.91% | 84.67% |
These figures underscore the company’s proficiency in managing cash flows and efficiently utilizing its capital resources.
⚠️ Balance Sheet & Leverage Analysis
Evaluating the balance sheet helps understand financial stability, liquidity, and leverage. Key metrics such as debt-to-equity, debt-to-assets, and current ratios are crucial for assessing long-term sustainability and operational flexibility. SBAC's leverage indicators reflect its strategic debt management.
| Year | 2025 | 2024 | 2023 |
|---|---|---|---|
| Debt-to-Equity | -0.90 | -3.08 | -2.80 |
| Debt-to-Assets | 37.62% | 138.00% | 142.10% |
| Debt-to-Capital | -872.93% | 147.99% | 155.65% |
| Net Debt to EBITDA | 2.04 | 8.67 | 7.96 |
| Current Ratio | 0.29 | 1.10 | 0.36 |
| Quick Ratio | 0.29 | 1.10 | 0.36 |
| Financial Leverage | -2.38 | -2.23 | -1.97 |
The balance sheet indicates a careful approach to debt management, essential for maintaining financial viability.
📊 Fundamental Strength & Profitability
Assessing profitability metrics such as return on equity (ROE), return on assets, and margins (Net, EBIT, EBITDA, Gross) allows evaluation of SBAC's financial health and efficiency in profit generation. The company’s R&D to revenue ratio reflects strategic investments in innovations that could drive future growth.
| Year | 2025 | 2024 | 2023 |
|---|---|---|---|
| Return on Equity | -21.71% | -14.67% | -9.70% |
| Return on Assets | 9.10% | 6.56% | 4.93% |
| Margins: Net | 37.43% | 27.97% | 18.51% |
| EBIT Margin | 60.74% | 56.91% | 39.65% |
| EBITDA Margin | 71.12% | 66.97% | 66.07% |
| Gross Margin | 0% | 77.32% | 76.61% |
| Research & Development to Revenue | 0% | 0% | 0% |
Despite some challenges in ROE, SBAC's profitability metrics exhibit efficiency and ongoing operational improvements.
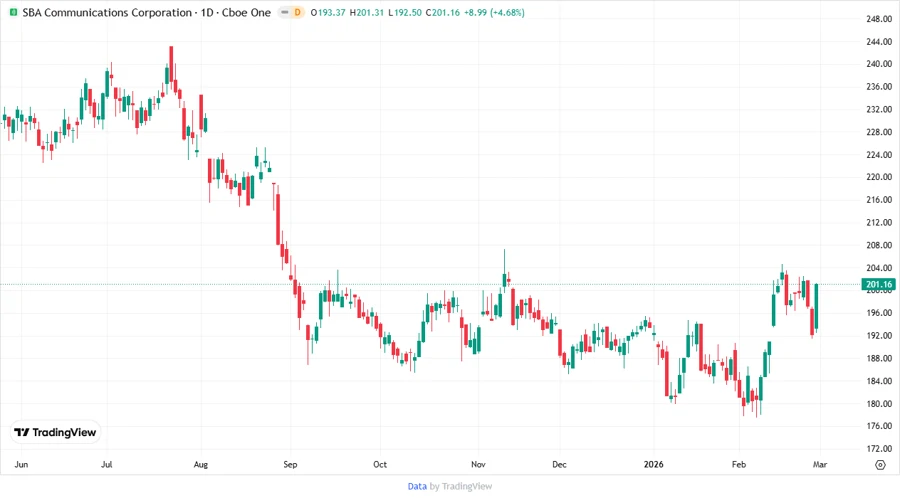
📈 Price Development
🌟 Dividend Scoring System
| Category | Score | Score Bar |
|---|---|---|
| Dividend Yield | 3/5 | |
| Dividend Stability | 4/5 | |
| Dividend Growth | 3/5 | |
| Payout Ratio | 4/5 | |
| Financial Stability | 3/5 | |
| Dividend Continuity | 4/5 | |
| Cashflow Coverage | 4/5 | |
| Balance Sheet Quality | 3/5 |
Total Score: 28/40
🗨️ Rating
SBA Communications Corporation illustrates a solid dividend and financial profile, with stable payout ratios, consistent dividend history, and sound management of cash flow and capital investments. While certain profitability metrics suggest areas for improvement, overall, the company maintains a sustainable dividend strategy and reliable financial standing. Investors may find SBAC a promising option for stable returns with moderate risk exposure.
Smart Data Insight
Master the Perfect Entry & Exit for this Stock
Don't leave your profits to chance. Historically, this stock follows specific seasonal patterns that institutional traders use to maximize returns.
- ✅ Identify the "Golden Buying Window"
- ✅ Avoid high-risk correction cycles
- ✅ Backtested data from the last 20+ years