February 20, 2026 a 07:46 am

SBAC: Dividend Analysis - SBA Communications Corporation
SBA Communications Corporation showcases a commendable dividend profile with a focus on steady growth and promising yield. Although their last dividend cut or suspension was non-existent, it is important to consider their negative return on equity in conjunction with their robust dividend growth. This suggests a resilience in their dividend policy despite financial pressure. Moreover, the relatively balanced dividend payout ratios indicate healthy company operations addressing both growth and shareholder returns.
📊 Overview
The analysis of SBA Communications Corporation reveals a consistent dividend track record over the past seven years, supported by positive dividend growth percentages over both three and five-year terms. The sector's dividend yield stands at 2.29%, with a current dividend of $3.93 per share, highlighting an attractive proposition for yield-focused investors. The absence of recent dividend cuts bolsters investor confidence and reflects the firm's strategic financial management.
| Key Metrics | Value |
|---|---|
| Sector | Real Estate |
| Dividend Yield | 2.29% |
| Current Dividend per Share | 3.93 USD |
| Dividend History | 7 years |
| Last Cut or Suspension | None |
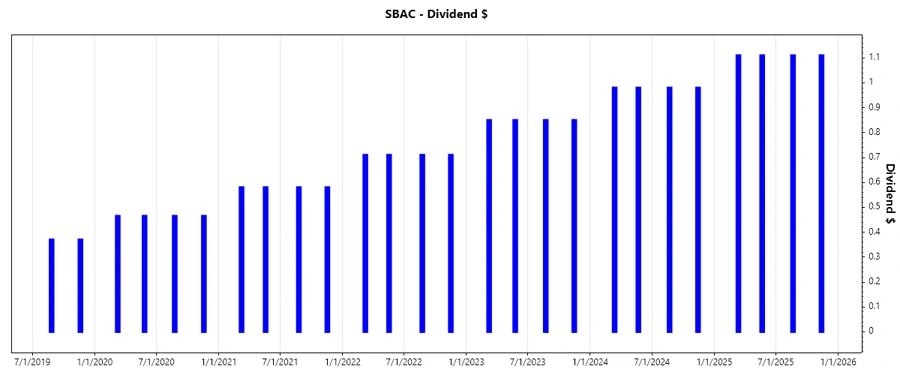
📈 Dividend History
Understanding dividend history is crucial for gauging the reliability and growth potential of the dividend policy. Recent increments in dividend payments signify sustained company profitability and a shareholder-friendly approach.
| Year | Dividend per Share (USD) |
|---|---|
| 2025 | 4.44 |
| 2024 | 3.92 |
| 2023 | 3.40 |
| 2022 | 2.84 |
| 2021 | 2.32 |
📈 Dividend Growth
Evaluating dividend growth offers insights into potential income escalations for shareholders. SBA's average dividend growth stands at 19.01% over the past five years, indicating stable expansion in payouts.
| Time | Growth |
|---|---|
| 3 years | 16.06% |
| 5 years | 19.01% |
The average dividend growth is 19.01% over 5 years. This shows moderate but steady dividend growth.
⚖️ Payout Ratio
Payout ratios are essential indicators determining the proportion of earnings distributed as dividends. SBA Communications demonstrates responsible payout strategies with 49.27% EPS-based and 38.76% Free Cash Flow-based ratios, suggesting efficient capital usage while safeguarding earnings for future growth potentials.
| Key Figure Ratio | Value |
|---|---|
| EPS-based | 49.27% |
| Free Cash Flow-based | 38.76% |
Both EPS and FCF payout ratios reflect a balanced approach, ensuring dividend payments while sustaining critical operations and investments.
🔍 Cashflow & Capital Efficiency
Analyzing cash flow and capital efficiency provides insights into operational robustness and capital deployment effectiveness within SBA Communications. Key indicators include Free Cash Flow/Operating Cash Flow ratios, alongside cash yields and CAPEX metrics, alluding to the company's adept management of operational cash and investment activities.
| Year | 2024 | 2023 | 2022 |
|---|---|---|---|
| Free Cash Flow Yield | 5.03% | 4.74% | 3.50% |
| Earnings Yield | 3.41% | 1.82% | 1.51% |
| CAPEX to Operating Cash Flow | 16.77% | 15.33% | 16.68% |
| Stock-based Compensation to Revenue | 2.78% | 3.24% | 3.79% |
| Free Cash Flow / Operating Cash Flow Ratio | 82.91% | 84.67% | 83.32% |
The cash flow data underscore the company's resourceful allocation of capital, sustaining strong cash generation to support ongoing and new investments essential for growth.
📊 Balance Sheet & Leverage Analysis
The financial metrics of SBA Communications' balance sheet highlight their leverage management and liquidity posture, essential elements for risk assessment and strategic decision-making concerning debt obligations.
| Year | 2024 | 2023 | 2022 |
|---|---|---|---|
| Debt-to-Equity | -3.08 | -2.80 | -2.88 |
| Debt-to-Assets | 1.38 | 1.42 | 1.43 |
| Debt-to-Capital | 1.48 | 1.56 | 1.53 |
| Net Debt to EBITDA | 8.67 | 7.96 | 8.97 |
| Current Ratio | 0.50 | 0.35 | 0.69 |
| Quick Ratio | 1.10 | 0.36 | 0.69 |
| Financial Leverage | -2.23 | -1.97 | -2.01 |
The ratios suggest heightened leverage usage, albeit supported by sufficient liquidity to meet short-term commitments despite the risks associated with high net debt levels relative to EBITDA.
📉 Fundamental Strength & Profitability
Evaluating profitability and efficiency indicators reveals SBA Communications’ competency in generating returns and managing costs. Although return on equity remains negative, operating and gross margins depict the underlying cost management and operational efficiency.
| Year | 2024 | 2023 | 2022 |
|---|---|---|---|
| Return on Equity | -14.67% | -9.70% | -8.75% |
| Return on Assets | 6.56% | 4.93% | 4.36% |
| Net Margin | 27.97% | 18.51% | 17.52% |
| EBIT Margin | 56.91% | 39.65% | 36.77% |
| EBITDA Margin | 66.97% | 66.07% | 63.64% |
| Gross Margin | 77.32% | 76.61% | 73.59% |
| Research & Development to Revenue | 0% | 0% | 0% |
The robust margins endorse the company's ability to siphon significant revenues into profits, notwithstanding negative returns on shareholder capital.
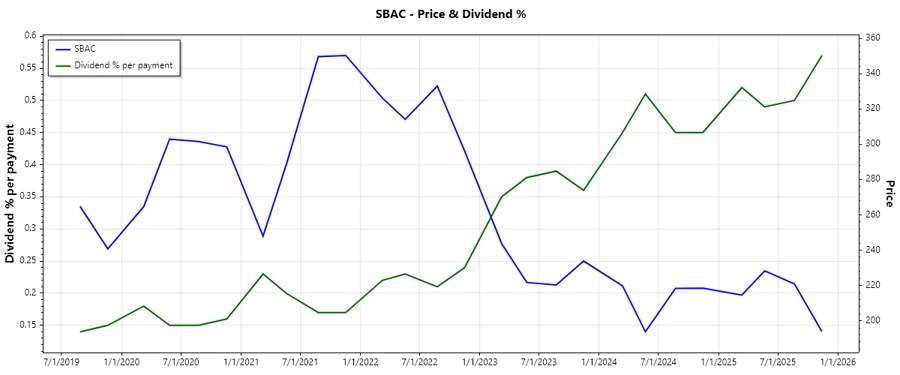
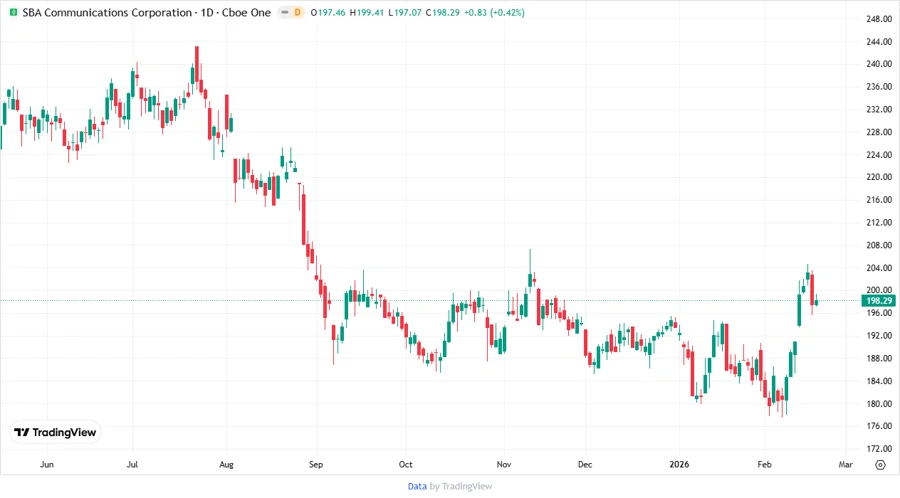
📉 Price Development
✅ Dividend Scoring System
| Category | Score (1-5) | |
|---|---|---|
| Dividend Yield | 4 | |
| Dividend Stability | 5 | |
| Dividend Growth | 4 | |
| Payout Ratio | 3 | |
| Financial Stability | 3 | |
| Dividend Continuity | 5 | |
| Cashflow Coverage | 4 | |
| Balance Sheet Quality | 2 |
Total Score: 30 out of 40
🗣️ Rating
SBA Communications Corporation exhibits a promising dividend profile with key strengths in dividend continuity and growth, offset by challenges in financial leverage and profitability. Investors may consider weighing the attractive yield against the financial risks, supported by continuous dividend payouts despite institutional pressures. Overall, a favorable buy for income-oriented portfolios, contingent on continued macroeconomic stability.
Smart Data Insight
Master the Perfect Entry & Exit for this Stock
Don't leave your profits to chance. Historically, this stock follows specific seasonal patterns that institutional traders use to maximize returns.
- ✅ Identify the "Golden Buying Window"
- ✅ Avoid high-risk correction cycles
- ✅ Backtested data from the last 20+ years