February 02, 2026 a 07:46 am

SBAC: Dividend Analysis - SBA Communications Corporation
SBA Communications Corporation showcases a stable dividend profile with a moderate yield. The company's focus on consistent dividend payments combined with its strategic reinvestment in infrastructure suggests a balanced approach to shareholder value. Investors should weigh the dividend stability against the relatively high payout ratios and volatile ROE trends, indicative of broader operational strategies.
📊 Overview
SBA Communications Corporation operates within the Telecommunications sector, offering a dividend yield of 2.29% with a current dividend per share of 3.93 USD. The company boasts a 7-year history of dividend payments, with no recent cuts or suspensions.
| Metric | Value |
|---|---|
| Sector | Telecommunications |
| Dividend yield | 2.29% |
| Current dividend per share | 3.93 USD |
| Dividend history | 7 years |
| Last cut or suspension | None |
🗣️ Dividend History
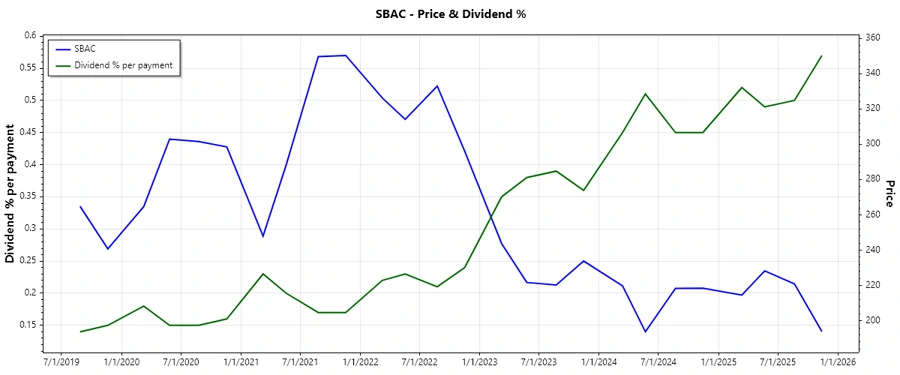
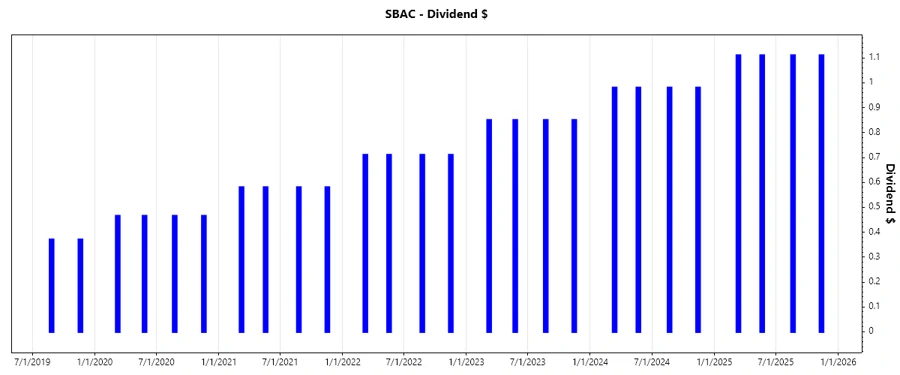
A detailed understanding of dividend history is crucial for assessing the reliability of payouts and investor return expectations. SBA has maintained a consistent upward trend in dividend payouts, demonstrating resilience and growth even during uncertain market conditions. This historical data aids in forecasting future dividend stability.
| Year | Dividend per Share (USD) |
|---|---|
| 2025 | 4.44 |
| 2024 | 3.92 |
| 2023 | 3.40 |
| 2022 | 2.84 |
| 2021 | 2.32 |
📈 Dividend Growth
Analyzing dividend growth over time can illuminate the company’s financial health and potential for future payouts. SBA Communications Corporation has demonstrated a 3-year growth of 16.06% and a 5-year growth of 19.01%. This steady increase underscores a commitment to rewarding shareholders amidst careful capital allocation.
| Time | Growth |
|---|---|
| 3 years | 16.06% |
| 5 years | 19.01% |
The average dividend growth is 19.01% over 5 years. This shows moderate but steady dividend growth.
✅ Payout Ratio
The payout ratio provides insight into the proportion of earnings and free cash flow distributed as dividends. With an EPS-based payout ratio of 49.27% and a FCF-based ratio of 38.76%, SBA shows a well-maintained balance between rewarding shareholders and reinvesting in growth opportunities.
| Key figure ratio | Value |
|---|---|
| EPS-based | 49.27% |
| Free cash flow-based | 38.76% |
The EPS payout ratio of 49.27% indicates a balanced approach to both retaining earnings and providing returns to shareholders, while the FCF payout ratio remains comfortably within sustainable limits.
⚠️ Cashflow & Capital Efficiency
Evaluating cash flow and capital efficiency metrics divulges the company’s ability to generate cash relative to its capital investments. SBA’s ratios reflect a strategic balance between cash flow generation and capital allocation for sustainable long-term growth.
| Metric | 2024 | 2023 | 2022 |
|---|---|---|---|
| Free Cash Flow Yield | 5.03% | 4.74% | 3.50% |
| Earnings Yield | 4.33% | 3.41% | 3.05% |
| CAPEX to Operating Cash Flow | 16.77% | 15.33% | 16.68% |
| Stock-based Compensation to Revenue | 2.67% | 3.24% | 3.79% |
| Free Cash Flow / Operating Cash Flow Ratio | 82.91% | 84.67% | 83.32% |
These data suggest that SBA is maintaining a good bound between capital expenditures and operational cash flow, ensuring efficient capital usage while sustaining cash flow coverage.
📉 Balance Sheet & Leverage Analysis
Understanding the leverage and liquidity ratios is crucial for assessing SBA’s ability to meet its financial obligations. Negative equity ratios alongside high debt metrics illustrate the capital structure and risk exposure.
| Metric | 2024 | 2023 | 2022 |
|---|---|---|---|
| Debt-to-Equity | -3.08 | -2.80 | -2.88 |
| Debt-to-Assets | 1.38 | 1.42 | 1.43 |
| Debt-to-Capital | 1.48 | 1.56 | 1.53 |
| Net Debt to EBITDA | 7.97 | 7.96 | 8.97 |
| Current Ratio | 0.50 | 0.36 | 0.69 |
| Quick Ratio | 1.10 | 0.36 | 0.69 |
| Financial Leverage | -2.23 | -1.97 | -2.01 |
The high leverage ratios indicate substantial reliance on debt, implying financial risk, whereas the quick ratio highlights limited liquid assets to cover short-term liabilities.
📊 Fundamental Strength & Profitability
Metrics such as return on equity and asset return, along with margin analysis, provide a window into the company’s profitability and operational efficiency. Despite challenges in earnings, SBA maintains competitive margins and operational strength.
| Metric | 2024 | 2023 | 2022 |
|---|---|---|---|
| Return on Equity | -14.67% | -9.70% | -8.75% |
| Return on Assets | 6.57% | 4.93% | 4.36% |
| Margins: Net | 27.97% | 18.51% | 17.52% |
| Margins: EBIT | 56.91% | 39.65% | 36.77% |
| Margins: EBITDA | 66.97% | 66.07% | 63.64% |
| Margins: Gross | 77.32% | 76.61% | 73.59% |
| R&D to Revenue | 0% | 0% | 0% |
The data shows strong operational efficiency through high EBITDA and gross margins, although negative equity affects the overall endeavor in profitability and return generation.
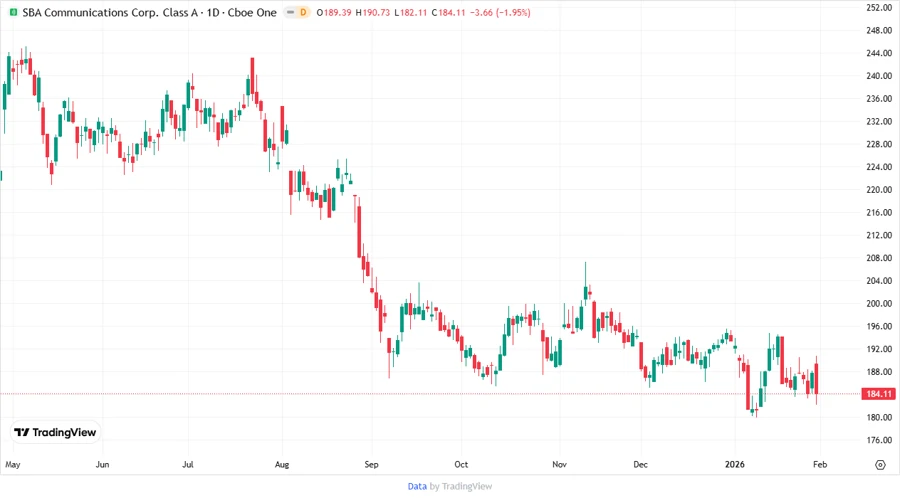
📈 Price Development
Dividend Scoring System
| Category | Score | Score Bar |
|---|---|---|
| Dividend yield | 3 | |
| Dividend Stability | 4 | |
| Dividend growth | 4 | |
| Payout ratio | 3 | |
| Financial stability | 2 | |
| Dividend continuity | 5 | |
| Cashflow Coverage | 3 | |
| Balance Sheet Quality | 2 |
Total Score: 26/40
Rating
SBA Communications Corporation presents a compelling dividend package for investors, driven by consistent growth and stable payouts. However, potential investors should be mindful of the high leverage levels and negative equity profiles. Overall, the company's operational strength and dividend commitment yield a moderate "Hold" recommendation, contingent upon ongoing monitoring of financial stability and market conditions.
Smart Data Insight
Master the Perfect Entry & Exit for this Stock
Don't leave your profits to chance. Historically, this stock follows specific seasonal patterns that institutional traders use to maximize returns.
- ✅ Identify the "Golden Buying Window"
- ✅ Avoid high-risk correction cycles
- ✅ Backtested data from the last 20+ years