October 15, 2025 a 11:31 am

SBAC: Dividend Analysis - SBA Communications Corporation
SBA Communications Corporation presents an intriguing investment opportunity with its stable dividend structure and healthy growth trajectory. Despite a neutral overall dividend yield, the company shows potential for growth and steady financial performance. This analysis delves into key financial metrics and historical performance to provide a comprehensive assessment of its dividend offering.
📊 Overview
SBA Communications is positioned in a rapidly evolving sector that demands consistent performance and operational efficiency. With a dividend yield of 1.95%, the focus is on sustainable payouts. The company has maintained a dividend history over 7 years, signaling reliability and traction in delivering shareholder value.
| Metric | Value |
|---|---|
| Sector | Communications Infrastructure |
| Dividend Yield | 1.95% |
| Current Dividend per Share | 3.94 USD |
| Dividend History | 7 years |
| Last Cut or Suspension | None |
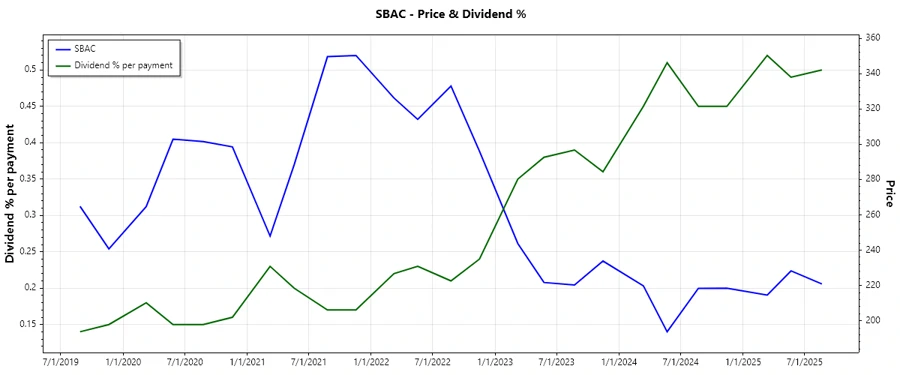
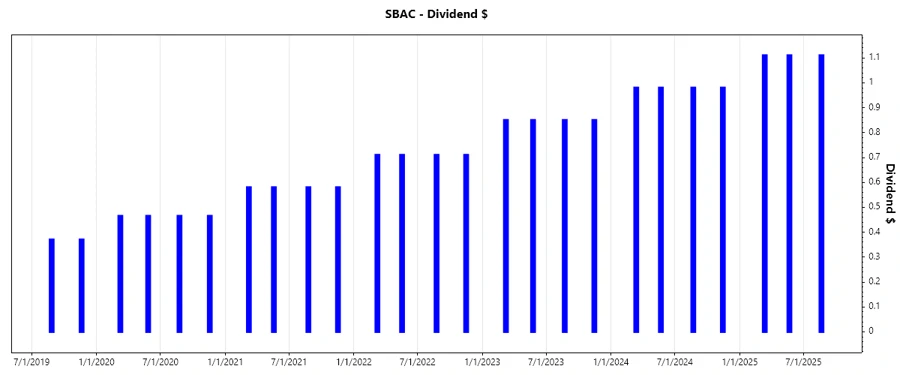
🗣️ Dividend History
The following table highlights SBA Communications' commitment to maintaining robust and growing dividends, which is a key driver of long-term shareholder value. Understanding past dividend payouts helps gauge future continuity and reliability.
| Year | Dividend per Share (USD) |
|---|---|
| 2025 | 3.33 |
| 2024 | 3.92 |
| 2023 | 3.40 |
| 2022 | 2.84 |
| 2021 | 2.32 |
📈 Dividend Growth
Observing the company's dividend growth over the years is crucial for understanding potential future increases in shareholder returns. Consistent growth trends provide assurance of financial robustness and strategic health.
| Time | Growth |
|---|---|
| 3 years | 19.11% |
| 5 years | 39.58% |
The average dividend growth is 39.58% over 5 years. This shows moderate but steady dividend growth.
💸 Payout Ratio
Payout ratios provide insight into the sustainability of dividend payments relative to earnings and cash flows. An optimal payout ratio ensures that dividends do not overshadow funding for growth and innovation.
| Key Figure | Ratio |
|---|---|
| EPS-based | 48.28% |
| Free Cash Flow-based | 39.85% |
The payout ratios illustrate a balanced approach to shareholder returns and reinvestment, where the 48.28% EPS payout is within acceptable bounds and the 39.85% FCF payout indicates robust financial health.
⚙️ Cashflow & Capital Efficiency
Cash flow metrics provide insights into the firm’s operational efficiency and capacity to fund dividends, growth, and debt servicing without stress.
| Metric | 2024 | 2023 | 2022 |
|---|---|---|---|
| Free Cash Flow Yield | 5.14% | 4.76% | 3.65% |
| Earnings Yield | 4.27% | 3.42% | 1.83% |
| CAPEX to Operating Cash Flow | 17.32% | 15.33% | 16.27% |
| Stock-based Compensation to Revenue | 2.63% | 3.24% | 3.79% |
| Free Cash Flow / Operating Cash Flow Ratio | 82.91% | 84.67% | 83.73% |
The cash flow ratios showcase a strong conversion of cash into profits and an efficient capital structuring, positioning the company to continue its growth trajectory while honoring dividend commitments.
📊 Balance Sheet & Leverage Analysis
A prudent balance sheet buffers against market volatility and ensures resilience. Key leverage ratios offer insights into the potential risks and capital flexibility of the entity.
| Metric | 2024 | 2023 | 2022 |
|---|---|---|---|
| Debt-to-Equity | -3.08 | -2.80 | -2.88 |
| Debt-to-Assets | 1.38 | 1.42 | 1.43 |
| Debt-to-Capital | 1.48 | 1.56 | 1.53 |
| Net Debt to EBITDA | 10.59 | 8.38 | 8.97 |
| Current Ratio | 1.10 | 0.36 | 0.69 |
| Quick Ratio | 1.10 | 0.36 | 0.69 |
Though the debt ratios are substantial, the interest coverage indicates that the financial burdens are manageable, signifying stability in liquidity and leverage.
🏦 Fundamental Strength & Profitability
Examining the core profitability metrics like ROE, ROA, and profit margins reveal the financial vigour and industry standing of the company.
| Metric | 2024 | 2023 | 2022 |
|---|---|---|---|
| Return on Equity | -14.67% | -9.70% | -8.75% |
| Return on Assets | 6.56% | 4.93% | 4.36% |
| Net Margin | 27.97% | 18.51% | 17.52% |
| EBIT Margin | 44.79% | 36.32% | 35.15% |
| EBITDA Margin | 54.84% | 62.73% | 63.64% |
While negative returns on equity suggest inefficiencies and potential concern, high EBITDA and net margins ensure ongoing profitability and strategic room for improvement.
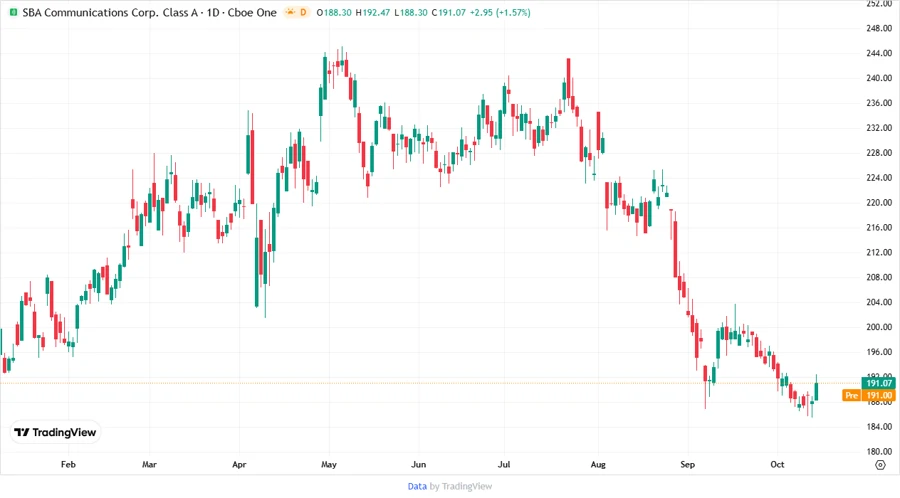
📉 Price Development
📈 Dividend Scoring System
| Category | Score | Bar |
|---|---|---|
| Dividend Yield | 3 | |
| Dividend Stability | 4 | |
| Dividend Growth | 3 | |
| Payout Ratio | 4 | |
| Financial Stability | 3 | |
| Dividend Continuity | 4 | |
| Cashflow Coverage | 3 | |
| Balance Sheet Quality | 3 |
Overall Score: 27/40
✅ Rating
SBA Communications Corporation is a sound investment opportunity for those seeking moderate dividend yields with the prospect of future growth and consistent payout history. However, some caution should be exercised regarding existing leverage. Investors may consider this stock as a reasonable component within a diversified dividend-focused portfolio.
Smart Data Insight
Master the Perfect Entry & Exit for this Stock
Don't leave your profits to chance. Historically, this stock follows specific seasonal patterns that institutional traders use to maximize returns.
- ✅ Identify the "Golden Buying Window"
- ✅ Avoid high-risk correction cycles
- ✅ Backtested data from the last 20+ years