June 26, 2026 a 07:43 am
SATS: Fundamental Ratio Analysis - EchoStar Corporation
EchoStar Corporation, under the ticker SATS, presents a mixed investment profile with its robust technology offerings through Hughes and ESS divisions. While it offers comprehensive satellite services globally, its fundamental ratings suggest a cautious approach. Investors should weigh potential long-term tech sector gains against current valuation indicators.
Fundamental Rating
The fundamental rating for EchoStar is currently at D+, indicating modest performance across core financial metrics. A closer look at scores shows uniformity across categories, each marked at a base level.
| Category | Score | Visualization |
|---|---|---|
| Discounted Cash Flow | 1 | |
| Return On Equity | 1 | |
| Return On Assets | 1 | |
| Debt To Equity | 1 | |
| Price To Earnings | 1 | |
| Price To Book | 1 |
Historical Rating
The historical scores indicate consistency in critical financial ratios without noticeable improvement or decline over the evaluations.
| Date | Overall | DCF | ROE | ROA | D/E | P/E | P/B |
|---|---|---|---|---|---|---|---|
| 2026-06-25 | 1 | 1 | 1 | 1 | 1 | 1 | 1 |
| Previous | 0 | 1 | 1 | 1 | 1 | 1 | 1 |
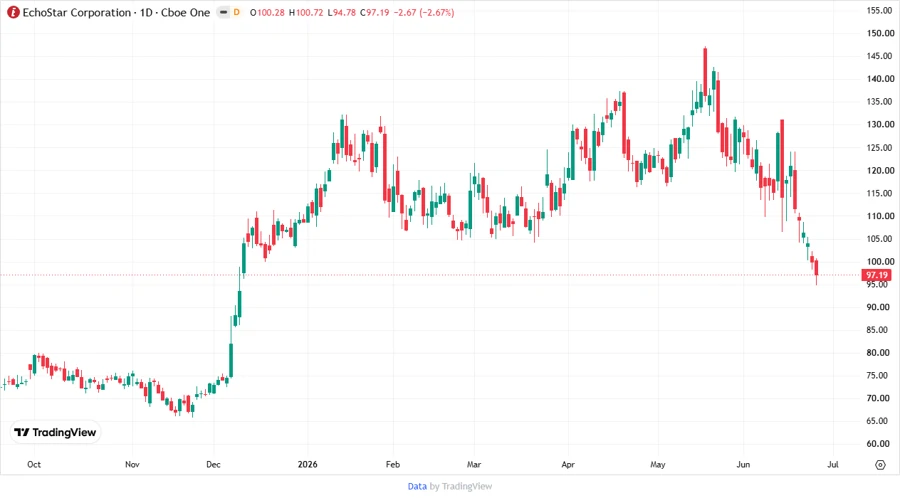
Analyst Price Targets
Analyst consensus suggests a positive outlook with a range of price targets indicating potential appreciation room.
| High | Low | Median | Consensus |
|---|---|---|---|
| 165 | 155 | 160 | Buy |
Analyst Sentiments
The market analysts show a favorable stance towards SATS, with the majority of recommendations tilted towards buying options.
| Recommendation | Count | Distribution |
|---|---|---|
| Strong Buy | 0 | |
| Buy | 6 | |
| Hold | 4 | |
| Sell | 1 | |
| Strong Sell | 0 |
Conclusion
EchoStar Corporation holds a strategic position in the global communication technology sector, leveraging diverse satellite services and solutions. While the company's current fundamental indicators show modest scores, the consensus among analysts is optimistic, projecting price appreciation potential. Potential investors should consider the sector's growth prospects and EchoStar's industry role, balancing these against valuation and financial metrics. Caution is warranted due to the uniformity of its low ratings and market volatility. Overall, SATS represents a calculated opportunity in an ever-evolving market niche.
Smart Data Insight
Master the Perfect Entry & Exit for this Stock
Don't leave your profits to chance. Historically, this stock follows specific seasonal patterns that institutional traders use to maximize returns.
- ✅ Identify the "Golden Buying Window"
- ✅ Avoid high-risk correction cycles
- ✅ Backtested data from the last 20+ years