
May 31, 2026 a 03:12 pm


Retail Stocks - Performance Analysis
Analyzing the recent performance of the largest retail sector stocks provides vital insights into the current market trends. Over the past three months, fluctuations have been witnessed as consumer spending habits shifted amidst economic pressures. This comprehensive analysis aims to give investors a detailed view of the top-performing and underperforming stocks in the retail sector. Through detailed data tables, we assess their performances over one week, one month, and three months, evaluating historical performance trends that could shape future investment decisions.
Retail Stocks Performance One Week
In the past week, Dollar General (DG) outshined with a notable 4.75% increase, signaling strong resilience. Amazon (AMZN) and Home Depot (HD) also posted gains, signaling potential stability. On the downside, Costco (COST) was the poorest performer, dropping 7.14% affected by market headwinds. This period's analysis suggests that while some market leaders are treading a cautious upward path, significant challenges remain.
| Stock | Performance (%) | Performance |
|---|---|---|
| DG | 4.75 | |
| AMZN | 1.64 | |
| HD | 1.33 | |
| TGT | 1.19 | |
| LOW | -0.26 | |
| ULTA | -1.14 | |
| TJX | -2.23 | |
| WMT | -3.79 | |
| JD | -5.65 | |
| COST | -7.14 |
Retail Stocks Performance One Month
Over the past month, the retail sector faced broader pressures, illustrated by Walmart (WMT) losing 12.42%, reflecting some consumer uncertainty. Amazon, although only slightly up by 1.04%, was the least affected. The broader negative trend is evident, with significant losses suggesting caution for short-term retail investments.
| Stock | Performance (%) | Performance |
|---|---|---|
| AMZN | 1.04 | |
| TGT | -0.94 | |
| TJX | -1.05 | |
| HD | -1.85 | |
| DG | -2.65 | |
| JD | -3.20 | |
| ULTA | -4.07 | |
| COST | -5.31 | |
| LOW | -8.18 | |
| WMT | -12.42 |
Retail Stocks Performance Three Months
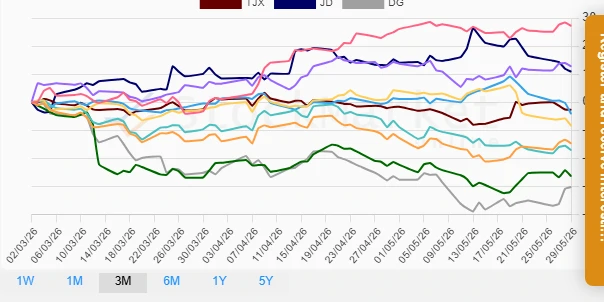
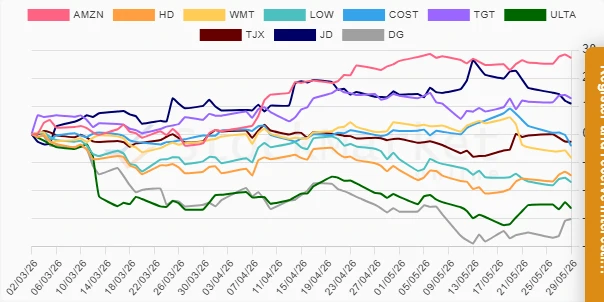
Amazon (AMZN) displayed robust growth, increasing by 27.15%, capturing positive consumer sentiment. Conversely, Dollar General (DG) and Ulta (ULTA) recorded significant declines, reflecting strategic and operational challenges. Walmart (WMT) and Lowe's (LOW) also faced substantial declines. This overall trend demonstrates a mixed landscape with specific success stories amidst broader hurdles.
| Stock | Performance (%) | Performance |
|---|---|---|
| AMZN | 27.15 | |
| TGT | 12.74 | |
| JD | 10.87 | |
| TJX | -2.70 | |
| COST | -4.18 | |
| WMT | -8.46 | |
| HD | -14.70 | |
| LOW | -17.13 | |
| ULTA | -26.42 | |
| DG | -30.26 |
Summary
Retail stocks have demonstrated a mixed performance across different timeframes. While Amazon showed consistent growth, others like Walmart, Lowe's, and Ulta faced notable challenges. These trends highlight the multifaceted dynamics at play within the retail sector, underscoring both opportunities and caution points for investors. Balancing between growth prospects and risk management strategies remains crucial in navigating this complex market landscape.
Smart Data Insight
Master the Perfect Entry & Exit for this Stock
Don't leave your profits to chance. Historically, this stock follows specific seasonal patterns that institutional traders use to maximize returns.
- ✅ Identify the "Golden Buying Window"
- ✅ Avoid high-risk correction cycles
- ✅ Backtested data from the last 20+ years