
June 28, 2026 a 03:12 pm


Retail Stocks - Performance Analysis
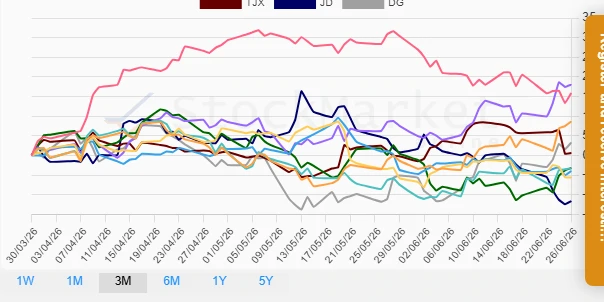
In the ever-evolving landscape of retail, stock performance remains a critical barometer for market sentiment and sector vitality. This analysis delves into the performance of leading retail stocks over three distinct time frames: one week, one month, and three months. By examining these periods, we can identify trends that may signal future performance while also understanding the challenges and opportunities unique to the retail sector.
📊 Retail Stocks Performance One Week
| Stock | Performance (%) | Performance |
|---|---|---|
| TGT | 7.34 | |
| ULTA | 6.98 | |
| DG | 5.34 | |
| HD | 4.46 | |
| LOW | 0.26 | |
| COST | 0.15 | |
| WMT | -1.23 | |
| AMZN | -4.71 | |
| TJX | -5.06 | |
| JD | -8.12 |
📊 Retail Stocks Performance One Month
| Stock | Performance (%) | Performance |
|---|---|---|
| TGT | 10.49 | |
| HD | 9.96 | |
| DG | 8.34 | |
| LOW | 4.15 | |
| TJX | 0.78 | |
| WMT | 0.15 | |
| COST | -0.29 | |
| ULTA | -3.65 | |
| JD | -12.42 | |
| AMZN | -14.55 |
📊 Retail Stocks Performance Three Months
| Stock | Performance (%) | Performance |
|---|---|---|
| TGT | 18.05 | |
| AMZN | 15.87 | |
| HD | 8.62 | |
| DG | 3.26 | |
| TJX | 0.61 | |
| ULTA | -3.20 | |
| LOW | -3.28 | |
| COST | -3.96 | |
| WMT | -5.62 | |
| JD | -11.62 |
Summary 🔍
Over the surveyed periods, Target (TGT) surfaced as a strong performer, consistently ranking among the top, especially in the three-month evaluation with an impressive 18.05%. Amazon (AMZN) showed significant improvement in the long-term timeline, whereas JD.com (JD) consistently fell behind, reflecting persistent challenges within certain market segments. The overall analysis reveals a mixed landscape, with significant variability in sector performance, highlighting both opportunities and cautionary tales for investors in retail stocks.
Smart Data Insight
Master the Perfect Entry & Exit for this Stock
Don't leave your profits to chance. Historically, this stock follows specific seasonal patterns that institutional traders use to maximize returns.
- ✅ Identify the "Golden Buying Window"
- ✅ Avoid high-risk correction cycles
- ✅ Backtested data from the last 20+ years