October 26, 2025 a 03:12 pm


Retail Stocks - Performance Analysis
📊 The retail sector has shown mixed performance over recent periods, reflecting broader economic and sector-specific challenges. This analysis provides insights into the fluctuating fortunes of leading stocks within this sector over short-term periods, offering valuable metrics for investors assessing potential positions. Performance varies by stock, with standout performances as well as notable underperformances.
Retail Stocks Performance One Week
🔍 Over the past week, Amazon (AMZN) and Target (TGT) emerged as top performers, indicative of strong market positioning and potentially favorable consumer sentiment. In contrast, Dollar General (DG) and Ulta Beauty (ULTA) underperformed, highlighting challenges perhaps associated with consumer trends or competitive pressures. The performance measures may reflect reactions to earnings reports or macroeconomic factors affecting consumer spending.
| Stock | Performance (%) | Performance |
|---|---|---|
| AMZN | 5.18 | |
| TGT | 3.75 | |
| JD | 0.46 | |
| COST | -0.43 | |
| LOW | -0.80 | |
| HD | -1.32 | |
| TJX | -1.34 | |
| WMT | -1.45 | |
| ULTA | -2.98 | |
| DG | -3.58 |
Retail Stocks Performance One Month
📈 In the past month, Target (TGT) demonstrated remarkable growth, with Walmart (WMT) also showing strength, suggesting resilience in consumer staples. Conversely, Ulta Beauty (ULTA) and Home Depot (HD) have experienced declines, potentially attributable to sectoral shifts and consumer behavior changes amid varying competitive landscapes.
| Stock | Performance (%) | Performance |
|---|---|---|
| TGT | 7.28 | |
| WMT | 3.05 | |
| AMZN | 2.28 | |
| COST | 1.90 | |
| DG | 0.20 | |
| TJX | -0.72 | |
| JD | -3.21 | |
| LOW | -5.66 | |
| HD | -5.78 | |
| ULTA | -6.29 |
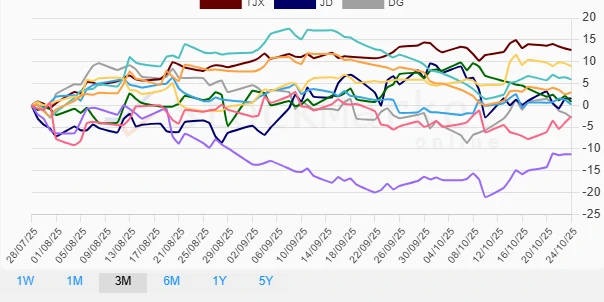
Retail Stocks Performance Three Months
✅ In a three-month span, TJX Companies (TJX) seized a substantial lead, highlighting possible market share gains or effective strategic initiatives. Walmart (WMT) also showcased robust results, affirming its dominant industry position. Conversely, Target (TGT) faced significant declines, implying potential challenges in its market approach or external market pressures. Understanding these shifts gives a clearer glimpse into future industry directions.
| Stock | Performance (%) | Performance |
|---|---|---|
| TJX | 12.66 | |
| WMT | 8.96 | |
| LOW | 5.93 | |
| HD | 2.95 | |
| JD | 1.55 | |
| ULTA | 0.84 | |
| COST | 0.20 | |
| AMZN | -2.54 | |
| DG | -2.79 | |
| TGT | -11.19 |
Summary
🔍 The varied performance across different periods underscores the dynamic nature of the retail sector, affected by seasonal demand, consumer preferences, and economic conditions. Strong gains by companies such as TJX and Walmart signal potential competitive advantages and market share consolidation. Conversely, challenges faced by companies like Target highlight the need for strategic reassessments to navigate an ever-changing market landscape. Investors should remain vigilant, adjusting strategies in response to ongoing market developments to optimize portfolio performance.
Smart Data Insight
Master the Perfect Entry & Exit for this Stock
Don't leave your profits to chance. Historically, this stock follows specific seasonal patterns that institutional traders use to maximize returns.
- ✅ Identify the "Golden Buying Window"
- ✅ Avoid high-risk correction cycles
- ✅ Backtested data from the last 20+ years