
July 26, 2026 a 03:12 pm


Retail Stocks - Performance Analysis
Over recent periods, the retail sector has shown a mixture of resilience and volatility. Some stocks have seen sharp declines, while others demonstrate significant gains. It is crucial to examine these patterns to make informed investment decisions.
📈 Retail Stocks Performance One Week
| Stock | Performance (%) | Performance |
|---|---|---|
| JD | 1.96 | |
| TJX | -0.15 | |
| LOW | -0.47 | |
| COST | -0.61 | |
| ULTA | -0.86 | |
| HD | -1.68 | |
| TGT | -1.99 | |
| WMT | -4.22 | |
| AMZN | -6.18 | |
| DG | -6.86 |
Within the past week, JD emerged as the only stock with a positive performance at 1.96%, while DG faced the highest loss at -6.86%. The retail giants, AMZN and WMT, also displayed notable declines, hinting at pressure points in the market dynamics. A cautious approach is advised as market behavior remains unpredictable.
📈 Retail Stocks Performance One Month
| Stock | Performance (%) | Performance |
|---|---|---|
| JD | 17.61 | |
| AMZN | 0.03 | |
| TJX | -0.65 | |
| DG | -1.41 | |
| COST | -1.64 | |
| TGT | -2.20 | |
| ULTA | -2.38 | |
| HD | -4.40 | |
| WMT | -5.28 | |
| LOW | -6.60 |
JD outperformed significantly with a growth spurt of 17.61%, making it the top performer in this period. Meanwhile, LOW struggled with a -6.60% decline, reflecting challenges in their market execution or external economic pressures.
📈 Retail Stocks Performance Three Months
| Stock | Performance (%) | Performance |
|---|---|---|
| TGT | 6.74 | |
| JD | 2.72 | |
| DG | 1.80 | |
| HD | 1.19 | |
| TJX | -1.33 | |
| COST | -5.86 | |
| ULTA | -11.51 | |
| AMZN | -10.75 | |
| WMT | -14.41 | |
| LOW | -14.41 |
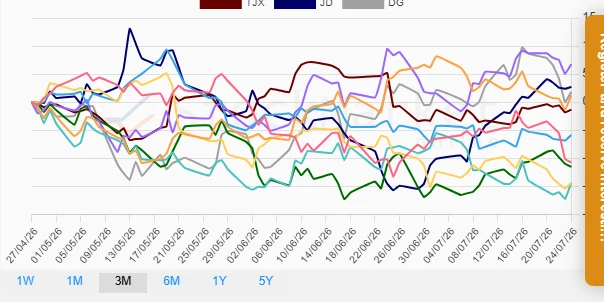
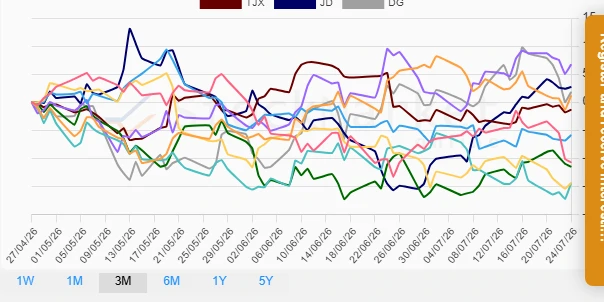
TGT showed a robust increase over three months with a 6.74% rise, while WMT and LOW both saw substantial decreases of 14.41%, indicating sectoral challenges or possible internal hurdles that need addressing.
✅ Summary
In summary, the retail sector displays varied performances across the different timeframes. JD has been consistently strong in the shorter term, while WMT and LOW's struggles indicate caution for investors. The trends suggest a need for a more diversified investment approach within the retail sector, focusing on stocks with consistent upward movement but keeping an eye on macroeconomic shifts that may impact these giants.
Smart Data Insight
Master the Perfect Entry & Exit for this Stock
Don't leave your profits to chance. Historically, this stock follows specific seasonal patterns that institutional traders use to maximize returns.
- ✅ Identify the "Golden Buying Window"
- ✅ Avoid high-risk correction cycles
- ✅ Backtested data from the last 20+ years