
October 25, 2026 a 03:12 pm


Retail Stocks - Performance Analysis
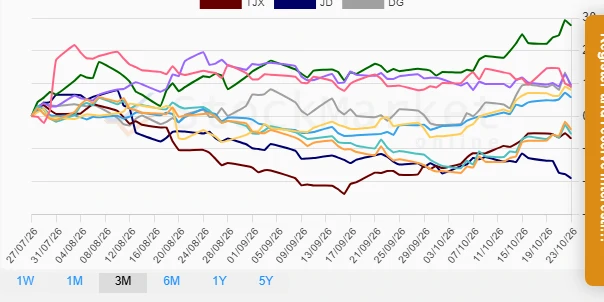
📊 The retail sector has shown varied performance over different periods, reflecting shifts in consumer sentiment and market conditions. While some stocks shine in short-term metrics, others exhibit longer-term resilience. This analysis will dive into the performance over the past week, month, and three months to extract insights, identify key trends, and highlight potential opportunities and risks.
Retail Stocks Performance One Week
| Stock | Performance (%) | Performance |
|---|---|---|
| ULTA | 5.33 | |
| HD | 3.38 | |
| COST | 1.46 | |
| WMT | 0.95 | |
| LOW | 0.79 | |
| AMZN | -0.57 | |
| TGT | -0.84 | |
| DG | -0.99 | |
| TJX | -1.52 | |
| JD | -6.22 |
Retail Stocks Performance One Month
| Stock | Performance (%) | Performance |
|---|---|---|
| ULTA | 13.92 | |
| TJX | 11.11 | |
| WMT | 10.70 | |
| HD | 9.05 | |
| COST | 8.48 | |
| DG | 6.62 | |
| LOW | 5.22 | |
| AMZN | -0.26 | |
| TGT | -2.74 | |
| JD | -4.20 |
Retail Stocks Performance Three Months
| Stock | Performance (%) | Performance |
|---|---|---|
| ULTA | 27.69 | |
| TGT | 9.46 | |
| AMZN | 9.08 | |
| DG | 8.73 | |
| WMT | 8.03 | |
| COST | 5.69 | |
| HD | -4.11 | |
| LOW | -5.42 | |
| TJX | -6.81 | |
| JD | -18.97 |
Summary
📉 The performance analysis over varying time horizons reveals distinct trends and patterns. ULTA emerged as a consistent top performer across all periods, showcasing strong relative stability and growth potential. Conversely, JD faced notable challenges with consistent underperformance, particularly over the three-month period. Investing in the retail sector requires discerning strategies to maximize opportunities offered by robust performers like ULTA while cautiously evaluating the long-term potential of stocks like JD that may face systemic challenges. Ultimately, diversification remains a prudent strategy to navigate the complexities inherent in this dynamic sector.
Smart Data Insight
Master the Perfect Entry & Exit for this Stock
Don't leave your profits to chance. Historically, this stock follows specific seasonal patterns that institutional traders use to maximize returns.
- ✅ Identify the "Golden Buying Window"
- ✅ Avoid high-risk correction cycles
- ✅ Backtested data from the last 20+ years