November 23, 2025 a 03:12 pm


Retail Stocks - Performance Analysis
The retail sector has been experiencing a volatile period, with certain stocks exhibiting substantial fluctuations over the past weeks and months. This analysis delves into the performance of key retail stocks over one week, one month, and three months to decipher prevailing trends and identify standout performers as well as underperformers. The analysis reveals a complex interplay of market forces influencing stock movements, providing insights for strategic investment decisions.
Retail Stocks Performance One Week
| Stock | Performance (%) | Performance |
|---|---|---|
| TJX | 3.64% | |
| WMT | 2.96% | |
| LOW | 2.95% | |
| TGT | -2.37% | |
| ULTA | -2.46% | |
| DG | -2.44% | |
| COST | -2.61% | |
| JD | -1.26% | |
| HD | -5.14% | |
| AMZN | -6.01% |
Retail Stocks Performance One Month
| Stock | Performance (%) | Performance |
|---|---|---|
| TJX | 6.61% | |
| DG | 0.09% | |
| ULTA | -0.08% | |
| WMT | -0.52% | |
| AMZN | -0.75% | |
| LOW | -3.28% | |
| COST | -3.54% | |
| TGT | -6.84% | |
| HD | -11.54% | |
| JD | -13.42% |
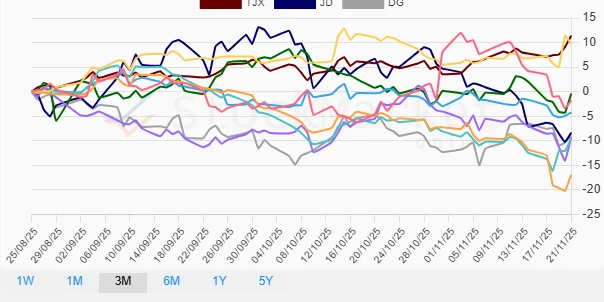
Retail Stocks Performance Three Months
| Stock | Performance (%) | Performance |
|---|---|---|
| TJX | 11.39% | |
| WMT | 9.75% | |
| ULTA | -0.44% | |
| AMZN | -1.81% | |
| COST | -4.29% | |
| JD | -8.36% | |
| DG | -8.93% | |
| TGT | -9.36% | |
| LOW | -9.51% | |
| HD | -16.96% |
Summary
The retail sector exhibits notable volatility, with TJX consistently emerging as a leading performer across different timeframes. Conversely, stocks like HD and JD show recurrent weaknesses. Strategically, investors may consider focusing on retailers with steady growth and resilience amid market fluctuations. An emphasis on long-term growth prospects and market position could benefit portfolios seeking diversification and potential mitigated risk exposure. Close monitoring and timely decision-making remain crucial in such a dynamic financial landscape.
Smart Data Insight
Master the Perfect Entry & Exit for this Stock
Don't leave your profits to chance. Historically, this stock follows specific seasonal patterns that institutional traders use to maximize returns.
- ✅ Identify the "Golden Buying Window"
- ✅ Avoid high-risk correction cycles
- ✅ Backtested data from the last 20+ years