
March 22, 2026 a 03:12 pm


Retail Stocks - Performance Analysis
🔍 In the bustling retail sector, tracking stock performance over different time horizons provides crucial insights into market dynamics. This analysis delves into the 1-week, 1-month, and 3-month performances of leading retail companies, identifying trends and offering an evaluative perspective. The period reveals both resilient performers and significant underperformers, with external market conditions playing a notable role.
Retail Stocks Performance One Week
📊 During the past week, the retail sector has experienced varied performance among major stocks. A closer analysis presents insights into investor sentiments and market conditions. The week highlighted that stocks such as TJX remained relatively stable with a mere -0.28% performance, while WMT saw a significant decline of -6.06%.
| Stock | Performance (%) | Performance |
|---|---|---|
| TJX | -0.28 | |
| ULTA | -0.97 | |
| AMZN | -1.04 | |
| TGT | -3.52 | |
| JD | -3.73 | |
| COST | -3.62 | |
| HD | -5.46 | |
| LOW | -5.50 | |
| DG | -5.55 | |
| WMT | -6.06 |
Retail Stocks Performance One Month
📉 The one-month performance review reveals significant market movements with some stocks experiencing notable declines. ULTA faced the steepest drop among its peers, descending by -23.92%, indicating sector-specific challenges or company-centric issues impacting investor confidence. Conversely, JD managed to sustain almost neutral performance with a marginal decline of only -0.15%.
| Stock | Performance (%) | Performance |
|---|---|---|
| JD | -0.15 | |
| TJX | -1.97 | |
| COST | -1.18 | |
| TGT | -2.61 | |
| AMZN | -2.02 | |
| WMT | -3.04 | |
| DG | -18.51 | |
| HD | -17.23 | |
| LOW | -21.72 | |
| ULTA | -23.92 |
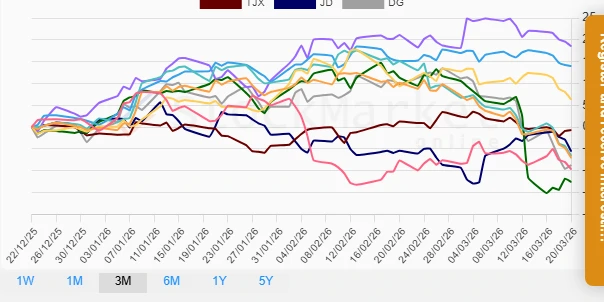
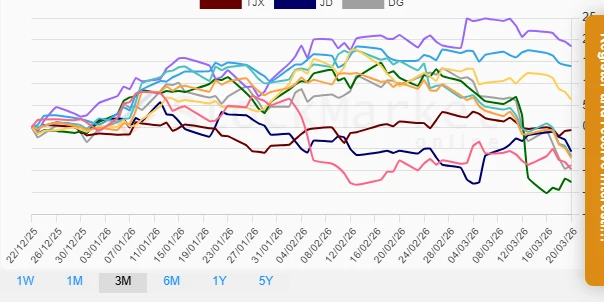
Retail Stocks Performance Three Months
📈 Over the three-month horizon, the retail sector appeared to offer varied results. TGT and COST emerged as the top performers with gains of 18.52% and 13.99% respectively, signaling potential bullish trends or strategic pivots yielding positive results. On the other hand, ULTA continued facing challenges, recording a -12.56% performance dip, reflecting prolonged headwinds that could affect long-term perceptions.
| Stock | Performance (%) | Performance |
|---|---|---|
| TJX | -0.69 | |
| JD | -5.56 | |
| LOW | -6.58 | |
| HD | -7.05 | |
| DG | -8.71 | |
| AMZN | -9.65 | |
| ULTA | -12.56 | |
| WMT | 6.33 | |
| COST | 13.99 | |
| TGT | 18.52 |
Summary
✅ In conclusion, the retail stock performance analysis over varying time spans reveals short-term volatility combined with potential long-term opportunities. Stocks like TGT and COST exhibit encouraging growth over the three-month period, suggesting strategic strengths and industry positioning. However, the pronounced underperformance of certain stocks, predominantly ULTA, highlights the necessity for closer scrutiny of underlying factors. As market dynamics continue to fluctuate, investors must align their strategies to emphasize portfolios that capture upward momentum while cautiously managing downtrends.
Smart Data Insight
Master the Perfect Entry & Exit for this Stock
Don't leave your profits to chance. Historically, this stock follows specific seasonal patterns that institutional traders use to maximize returns.
- ✅ Identify the "Golden Buying Window"
- ✅ Avoid high-risk correction cycles
- ✅ Backtested data from the last 20+ years