February 22, 2026 a 03:12 pm


Retail Stocks - Performance Analysis
In the dynamic landscape of retail investments, the recent performance over varied time horizons provides crucial insight for stakeholders. Through this comprehensive evaluation of prominent retail stocks over one week, one month, and three months periods, we identify shifting trends and crucial drivers behind changes in stock values. As market conditions evolve, these data points are crucial in facilitating informed decision-making.
📊 Retail Stocks Performance One Week
| Stock | Performance (%) | Performance |
|---|---|---|
| AMZN | 5.59% | |
| TJX | 2.44% | |
| JD | 0.99% | |
| TGT | 0.80% | |
| ULTA | 0.03% | |
| DG | -2.05% | |
| HD | -2.24% | |
| LOW | -2.45% | |
| COST | -3.30% | |
| WMT | -8.38% |
📊 Retail Stocks Performance One Month
| Stock | Performance (%) | Performance |
|---|---|---|
| TGT | 8.10% | |
| WMT | 4.77% | |
| TJX | 3.36% | |
| DG | 2.82% | |
| LOW | 1.43% | |
| COST | 0.37% | |
| HD | -0.27% | |
| ULTA | -0.08% | |
| JD | -8.33% | |
| AMZN | -12.50% |
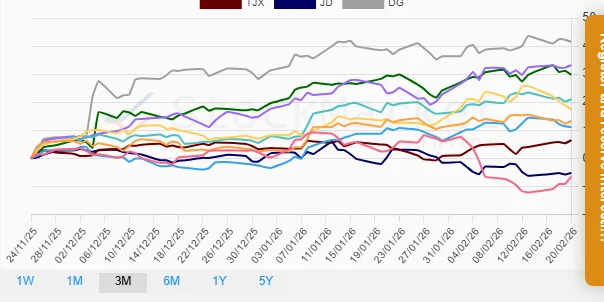
📊 Retail Stocks Performance Three Months
| Stock | Performance (%) | Performance |
|---|---|---|
| DG | 41.52% | |
| TGT | 33.21% | |
| ULTA | 29.79% | |
| LOW | 20.98% | |
| WMT | 17.44% | |
| HD | 13.29% | |
| COST | 11.13% | |
| TJX | 6.43% | |
| JD | -5.25% | |
| AMZN | -6.57% |
🗣️ Summary
Throughout the observed periods, Dollar General (DG) and Target (TGT) exhibit robust performance across the medium-term horizon. TGT's consistent gains highlight its compelling strategic positioning within the retail industry. Conversely, Amazon (AMZN) and JD.com (JD) have shown signs of volatility and challenges over the one-month and three-month spans, respectively. These performances suggest an adaptive approach where investments could be carefully managed to leverage the upwards momentum carried by top-performing stocks while remaining cautious amid potential downturns faced by others.
Smart Data Insight
Master the Perfect Entry & Exit for this Stock
Don't leave your profits to chance. Historically, this stock follows specific seasonal patterns that institutional traders use to maximize returns.
- ✅ Identify the "Golden Buying Window"
- ✅ Avoid high-risk correction cycles
- ✅ Backtested data from the last 20+ years