September 21, 2025 a 03:12 pm


Retail Stocks - Performance Analysis
In this comprehensive analysis, we delve into the performance of major retail sector equities over various time horizons. Evaluating weekly, monthly, and quarterly shifts, we identify top performers and underperformers, revealing critical insights and trends that may influence future investment decisions in a dynamic market.
📊 Retail Stocks Performance One Week
| Stock | Performance (%) | Performance |
|---|---|---|
| JD | 4.23 | |
| AMZN | 1.47 | |
| ULTA | 1.39 | |
| TJX | 0.22 | |
| WMT | -1.12 | |
| COST | -1.74 | |
| HD | -1.67 | |
| TGT | -2.02 | |
| DG | -2.10 | |
| LOW | -2.46 |
📊 Retail Stocks Performance One Month
| Stock | Performance (%) | Performance |
|---|---|---|
| JD | 10.06 | |
| WMT | 5.63 | |
| TJX | 2.38 | |
| AMZN | 1.39 | |
| HD | 0.77 | |
| LOW | 0.65 | |
| COST | -0.70 | |
| ULTA | -0.79 | |
| DG | -9.31 | |
| TGT | -11.66 |
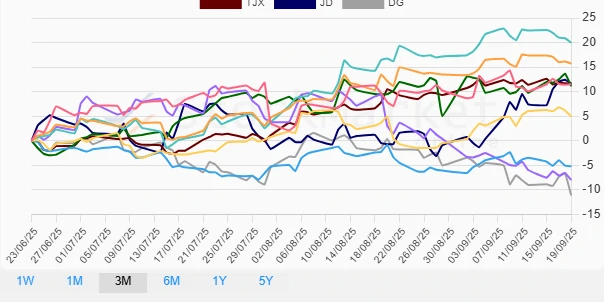
📊 Retail Stocks Performance Three Months
| Stock | Performance (%) | Performance |
|---|---|---|
| LOW | 19.98 | |
| HD | 15.71 | |
| TJX | 11.62 | |
| JD | 11.65 | |
| AMZN | 11.54 | |
| ULTA | 11.16 | |
| WMT | 4.94 | |
| COST | -5.20 | |
| TGT | -7.98 | |
| DG | -11.09 |
🔍 Summary
The retail stock sector demonstrates a dynamic range of performance across different timelines, mediated by external market conditions and internal operational effectiveness. Over the one-week period, JD emerged as a notable outperformer, while LOW lagged significantly. The monthly perspective highlighted JD once again, along with WMT, as resilient stocks, whereas TGT experienced substantial declines. Examining the three-month data reveals LOW holding the top position, reflecting strategic strength, while DG marked the downside. Investors should consider the robust potential within JD and LOW, with close monitoring required on TGT's descending trajectory.
Smart Data Insight
Master the Perfect Entry & Exit for this Stock
Don't leave your profits to chance. Historically, this stock follows specific seasonal patterns that institutional traders use to maximize returns.
- ✅ Identify the "Golden Buying Window"
- ✅ Avoid high-risk correction cycles
- ✅ Backtested data from the last 20+ years