
June 21, 2026 a 03:12 pm


Retail Stocks - Performance Analysis
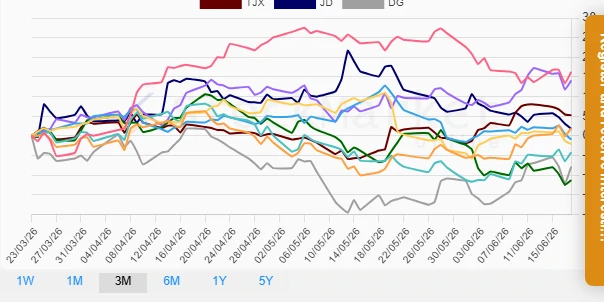
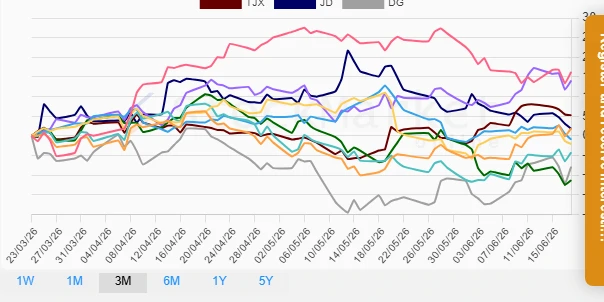
📊 In this comprehensive analysis, we delve into the performance of major retail stocks over varying time frames — 1 week, 1 month, and 3 months. These insights help in understanding market dynamics and identifying the leading and lagging stocks within the retail sector. We'll explore trends, pinpoint key performers, and offer strategic observations to enhance your investment decisions.
Retail Stocks Performance One Week
🔍 This week's data showcases a mix of positive and negative performances among leading retail stocks. Evidently, Amazon (AMZN) emerged as the top performer with a notable 2.56% increase. Contrarily, JD.com (JD) experienced the greatest decline by 3.51%, reflecting broader challenges within its operational landscape.
| Stock | Performance (%) | Performance |
|---|---|---|
| AMZN | 2.56 | |
| HD | 1.87 | |
| LOW | 0.73 | |
| DG | -0.95 | |
| ULTA | -2.45 | |
| TJX | -2.75 | |
| COST | -3.16 | |
| WMT | -3.21 | |
| TGT | -3.25 | |
| JD | -3.51 |
Retail Stocks Performance One Month
📈 Over the past month, Dollar General (DG) has led with a striking 7.75% uptick, while Ulta Beauty (ULTA) saw a substantial decline of -11.77%. This diversity in performance underscores the varying market responses each company faced.
| Stock | Performance (%) | Performance |
|---|---|---|
| DG | 7.75 | |
| HD | 6.83 | |
| TGT | 4.34 | |
| LOW | 3.63 | |
| TJX | 3.61 | |
| WMT | -2.41 | |
| COST | -7.58 | |
| AMZN | -8.20 | |
| JD | -9.95 | |
| ULTA | -11.77 |
Retail Stocks Performance Three Months
⚠️ Analysis over the past quarter reveals significant divergence with Amazon (AMZN) achieving an exceptional 16.25% boost, a stark contrast to Ulta Beauty’s (ULTA) -11.31% slide. The mixed performance reflects differential growth patterns and market expectations.
| Stock | Performance (%) | Performance |
|---|---|---|
| AMZN | 16.25 | |
| TGT | 14.05 | |
| TJX | 5.25 | |
| HD | 1.93 | |
| JD | 1.83 | |
| COST | -0.95 | |
| WMT | -2.10 | |
| LOW | -4.20 | |
| DG | -7.87 | |
| ULTA | -11.31 |
Summary
✅ This analysis reveals pronounced volatility and variations in the retail sector, with notable standouts such as Amazon's robust quarterly growth and Dollar General's monthly gains. Conversely, Ulta Beauty frequently underperformed across all examined periods, pointing to potential underlying issues. Investors should remain vigilant, keeping an eye on macroeconomic influences and individual stock performances within the retail domain.
Smart Data Insight
Master the Perfect Entry & Exit for this Stock
Don't leave your profits to chance. Historically, this stock follows specific seasonal patterns that institutional traders use to maximize returns.
- ✅ Identify the "Golden Buying Window"
- ✅ Avoid high-risk correction cycles
- ✅ Backtested data from the last 20+ years