October 19, 2025 a 03:12 pm


Retail Stocks - Performance Analysis
The retail sector has demonstrated varied performance across different time frames. While some stocks have outperformed significantly, others have struggled to maintain traction. The analysis highlights sector resilience and identifies opportunities for strategic investment, emphasizing the significance of market dynamics over the last quarter.
Retail Stocks Performance One Week 📊
| Stock | Performance (%) | Performance |
|---|---|---|
| DG | 6.50 | |
| TGT | 6.09 | |
| WMT | 5.78 | |
| LOW | 5.27 | |
| HD | 4.24 | |
| JD | 3.89 | |
| TJX | 2.48 | |
| COST | 0.75 | |
| AMZN | -1.52 | |
| ULTA | -2.90 |
Retail Stocks Performance One Month 📈
| Stock | Performance (%) | Performance |
|---|---|---|
| DG | 3.83 | |
| TGT | 3.26 | |
| TJX | 2.98 | |
| ULTA | 2.44 | |
| WMT | 5.31 | |
| COST | -1.39 | |
| JD | -5.11 | |
| HD | -5.81 | |
| LOW | -7.92 | |
| AMZN | -8.02 |
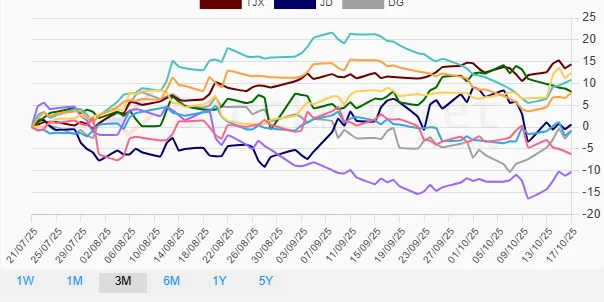
Retail Stocks Performance Three Months 📉
| Stock | Performance (%) | Performance |
|---|---|---|
| TJX | 14.37 | |
| WMT | 12.42 | |
| LOW | 10.82 | |
| ULTA | 8.14 | |
| HD | 7.85 | |
| JD | 0.57 | |
| COST | -0.81 | |
| DG | -0.85 | |
| AMZN | -6.19 | |
| TGT | -10.27 |
Summary 🗣️
The retail sector has showcased both resilience and volatility over the past periods. TJX and WMT have emerged as consistent outperformers, illustrating strong retail market influence. Conversely, AMZN and TGT faced significant challenges, underperforming in the given timelines. Strategic investment assessments suggest focusing on retailers demonstrating robust market adaptation and growth potential, whilst closely monitoring those underperforming for potential recovery opportunities.
Smart Data Insight
Master the Perfect Entry & Exit for this Stock
Don't leave your profits to chance. Historically, this stock follows specific seasonal patterns that institutional traders use to maximize returns.
- ✅ Identify the "Golden Buying Window"
- ✅ Avoid high-risk correction cycles
- ✅ Backtested data from the last 20+ years