
October 18, 2026 a 03:12 pm


Retail Stocks - Performance Analysis
The retail sector has shown varied performance across different time horizons, reflecting broader economic sentiment and specific company dynamics. Over the short term, we observe robust movements among top players, with notable disparities between them. This analysis delves into the weekly, monthly, and quarterly performance metrics for major retail stocks, providing a strategic view to guide informed investment decisions. Let’s explore the trends, winners, and laggards in the current retail landscape.
📊 Retail Stocks Performance One Week
The performance of retail stocks over the past week indicates a positive sentiment, with most stocks exhibiting upward trends. Noteworthy performers include Walmart (WMT), Home Depot (HD), and Lowe's (LOW), showing significant gains. Amazon (AMZN) experienced the most notable decline during this period. Analyzing these trends can offer insights into the immediate market reactions to retail activities and consumer sentiments.
| Stock | Performance (%) | Performance |
|---|---|---|
| WMT | 6.57 | |
| HD | 6.40 | |
| TJX | 6.06 | |
| LOW | 6.04 | |
| DG | 5.58 | |
| COST | 4.41 | |
| ULTA | 4.00 | |
| TGT | 0.45 | |
| JD | -0.25 | |
| AMZN | -4.82 |
📊 Retail Stocks Performance One Month
Over the past month, the retail sector has shown resilience, with TJX Companies (TJX) leading the gains followed by Walmart (WMT) and Costco (COST). Discount chains show notable strength indicating a shift in consumer preferences towards cost-efficiency. Meanwhile, Target (TGT) exhibited declines reflecting some underlying challenges. This period highlights shifting consumer dynamics and economic adjustments within the retail sector.
| Stock | Performance (%) | Performance |
|---|---|---|
| TJX | 14.87 | |
| WMT | 10.98 | |
| COST | 10.08 | |
| DG | 9.62 | |
| ULTA | 9.44 | |
| HD | 3.47 | |
| LOW | 2.83 | |
| JD | 0.52 | |
| AMZN | -1.24 | |
| TGT | -2.35 |
📊 Retail Stocks Performance Three Months
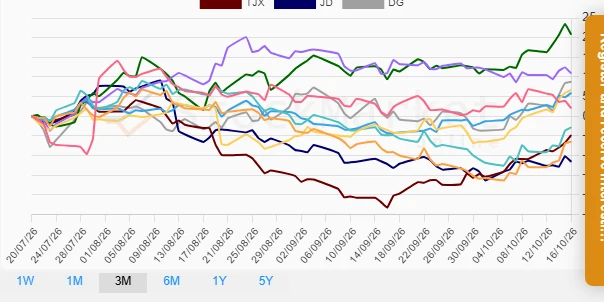
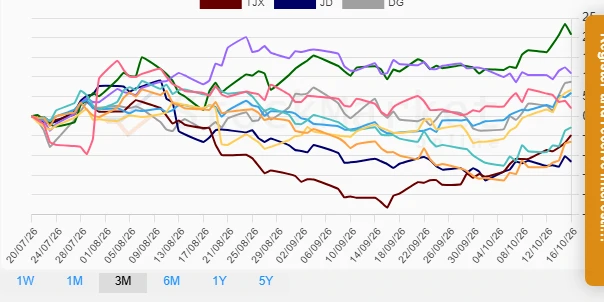
Over the quarterly period, retail stocks displayed significant variations in performance. Ulta Beauty (ULTA) emerged as a standout performer with substantial gains, reflecting strong consumer demand and strategic positioning. Conversely, JD.com (JD) and Home Depot (HD) posted declines, indicative of broader macroeconomic pressures and sector-specific challenges. These results underscore the dynamic nature of the retail market and the importance of strategic adaptation.
| Stock | Performance (%) | Performance |
|---|---|---|
| ULTA | 20.81 | |
| TGT | 10.92 | |
| WMT | 6.72 | |
| COST | 5.93 | |
| DG | 8.77 | |
| AMZN | 2.04 | |
| LOW | -2.87 | |
| TJX | -4.84 | |
| HD | -6.52 | |
| JD | -11.58 |
🔍 Summary
The retail sector's performance across varying timeframes showcases the dynamic nature of market conditions and consumer behavior. While traditional retail players like Walmart and Home Depot exhibit strength, there is a clear shift towards discount models and beauty segments, as evidenced by TJX and Ulta's performance. Retailers are navigating economic uncertainty with varied success, highlighting the importance of adaptive strategies in maintaining market competitiveness. Investors are advised to consider diversification within the sector, focusing on emergent growth trends and established resilience in a fluctuating economy.
Smart Data Insight
Master the Perfect Entry & Exit for this Stock
Don't leave your profits to chance. Historically, this stock follows specific seasonal patterns that institutional traders use to maximize returns.
- ✅ Identify the "Golden Buying Window"
- ✅ Avoid high-risk correction cycles
- ✅ Backtested data from the last 20+ years