May 17, 2026 a 03:12 pm


Retail Stocks - Performance Analysis
📊 The retail sector has experienced significant volatility across different time horizons. Investors need to carefully analyze both short-term shifts and long-term trends in performance. Notably, some stocks have demonstrated resilience, while others have shown pronounced weaknesses, leading to varied investment opportunities and risks.
Retail Stocks Performance One Week
🔍 Over the course of the past week, the retail sector exhibited varied performance. JD emerged as the top performer with a positive movement of 6.43%, whereas Dollar General (DG) experienced significant setbacks, dropping by 9.71%. The fragile economic conditions seemed to have amplified volatility, with COST standing out positively whereas major retailers like HD and DG struggled.
| Stock | Performance (%) | Performance |
|---|---|---|
| JD | 6.43 | |
| COST | 3.95 | |
| WMT | 0.83 | |
| TGT | -2.79 | |
| AMZN | -3.14 | |
| TJX | -3.87 | |
| ULTA | -5.29 | |
| LOW | -4.75 | |
| HD | -6.42 | |
| DG | -9.71 |
Retail Stocks Performance One Month
🔍 Over the past month, the retail sector has experienced substantial shifts, with Amazon (AMZN) achieving a noteworthy gain of 5.47%, and Dollar General (DG) suffering a steep decline of 20.71%. High variability in stock performance underscores sector-specific challenges and highlights strategic opportunities for investors.
| Stock | Performance (%) | Performance |
|---|---|---|
| AMZN | 5.47 | |
| COST | 4.91 | |
| WMT | 3.20 | |
| JD | 1.85 | |
| TGT | -4.71 | |
| TJX | -8.51 | |
| ULTA | -10.95 | |
| LOW | -13.84 | |
| HD | -15.82 | |
| DG | -20.71 |
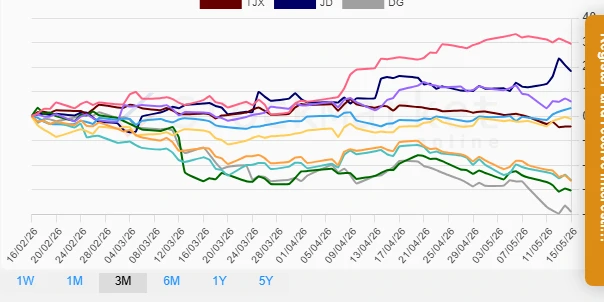
Retail Stocks Performance Three Months
🔍 Over the last three months, Amazon (AMZN) showcased a remarkable upward trend with a gain of 29.46%, emphasizing its robust market position. Conversely, Dollar General (DG), Home Depot (HD), and Lowe's (LOW) faced significant declines, indicating potential operational challenges and economic pressures within this subgroup of retail stocks.
| Stock | Performance (%) | Performance |
|---|---|---|
| AMZN | 29.46 | |
| JD | 18.24 | |
| TGT | 5.91 | |
| COST | 3.35 | |
| WMT | -1.11 | |
| TJX | -4.18 | |
| LOW | -26.18 | |
| HD | -26.35 | |
| ULTA | -30.28 | |
| DG | -38.96 |
Summary
💡 The retail sector's performance analysis over different periods reveals a stark contrast in individual stock behaviors. While stocks like JD and Amazon (AMZN) demonstrate strong resilience and growth prospects, others like Dollar General (DG) and Home Depot (HD) face headwinds, suggesting deeper market challenges. Investors should carefully analyze these dynamics to optimize portfolio strategies, weighing growth potential against risk exposure.
Smart Data Insight
Master the Perfect Entry & Exit for this Stock
Don't leave your profits to chance. Historically, this stock follows specific seasonal patterns that institutional traders use to maximize returns.
- ✅ Identify the "Golden Buying Window"
- ✅ Avoid high-risk correction cycles
- ✅ Backtested data from the last 20+ years