
November 15, 2026 a 03:11 pm


Retail Stocks - Performance Analysis
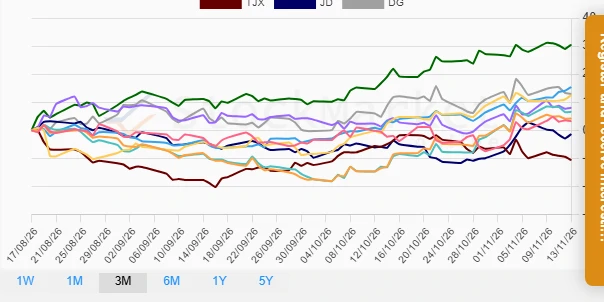
📊 Analyzing the performance of retail sector stocks, we look into the dynamics over the short to medium term. As consumer behavior and market trends fluctuate, identifying the outperformers and laggards becomes key for investment decisions. Let us delve into the week-by-week, month-by-month, and quarterly performance to comprehend broader sectoral movements and individual stock dynamics.
Retail Stocks Performance One Week
🔍 Over the past week, COST emerged as the top performer with a notable 4.91% increase, reflecting strong market sentiments. Notably, JD encountered the most substantial decline at -4.14%, hinting at potential uncertainties or unfavorable news impacting its short-term price action.
| Stock | Performance (%) | Performance |
|---|---|---|
| COST | 4.91 | |
| AMZN | 2.87 | |
| ULTA | 2.51 | |
| TGT | 2.05 | |
| WMT | 2.04 | |
| HD | 1.56 | |
| LOW | 1.47 | |
| DG | 0.33 | |
| TJX | -0.66 | |
| JD | -4.14 |
Retail Stocks Performance One Month
📈 Examining the past month, LOW demonstrated an impressive surge, topping the list at 15.00%. Conversely, TJX faced the greatest setback with a -8.79% dip, indicating potential challenges in their operational strategies or external market pressures.
| Stock | Performance (%) | Performance |
|---|---|---|
| LOW | 15.00 | |
| HD | 12.45 | |
| COST | 11.40 | |
| ULTA | 11.26 | |
| WMT | 7.77 | |
| AMZN | 7.12 | |
| TGT | 5.18 | |
| JD | 3.62 | |
| DG | 0.81 | |
| TJX | -8.79 |
Retail Stocks Performance Three Months
📉 During the three-month window, ULTA led with an exceptional 30.47% increment, possibly indicating a successful strategic shift or strong financial performance. Conversely, TJX was the biggest underperformer, falling by -10.62%, which could reflect operational hurdles or shifts in consumer preferences.
| Stock | Performance (%) | Performance |
|---|---|---|
| ULTA | 30.47 | |
| COST | 15.36 | |
| DG | 12.92 | |
| WMT | 12.47 | |
| TGT | 7.98 | |
| LOW | 6.55 | |
| HD | 4.21 | |
| AMZN | 3.23 | |
| JD | -1.40 | |
| TJX | -10.62 |
Summary
✅ The retail sector has evidenced varied performance in the past weeks and months, highlighting the importance of keen stock evaluation. ULTA stands out as a consistent outperformer, showcasing strategic and operational superiority within the sector. Conversely, TJX's underperformance across different periods indicates potential red flags that investors might want to investigate more deeply. The diverse performance within the sector emphasizes the necessity for strategic allocation and due diligence.
Smart Data Insight
Master the Perfect Entry & Exit for this Stock
Don't leave your profits to chance. Historically, this stock follows specific seasonal patterns that institutional traders use to maximize returns.
- ✅ Identify the "Golden Buying Window"
- ✅ Avoid high-risk correction cycles
- ✅ Backtested data from the last 20+ years