March 15, 2026 a 03:12 pm


Retail Stocks - Performance Analysis
Examining the performance of major retail stocks over varying time frames reveals significant volatility, with notable swings in both directions. The analysis will uncover the top performers and underperformers, providing insights into broader market trends affecting the retail sector.
Retail Stocks Performance One Week 📊
The one-week performance of retail stocks highlights a turbulent market period with JD leading the gains, while ULTA shows stark underperformance. Market sentiment continues to shift, reflecting broader economic uncertainties.
| Stock | Performance (%) | Performance |
|---|---|---|
| JD | 4.71% | |
| WMT | 2.21% | |
| COST | 1.05% | |
| TJX | -2.45% | |
| AMZN | -2.62% | |
| TGT | -2.84% | |
| HD | -5.33% | |
| LOW | -5.77% | |
| DG | -10.16% | |
| ULTA | -17.54% |
Retail Stocks Performance One Month 📈
AMZN and JD showed resilience over the month, buoyed by positive investor sentiment. Conversely, ULTA faced significant headwinds. The divergence in performance underscores varying company strategies and external pressures.
| Stock | Performance (%) | Performance |
|---|---|---|
| AMZN | 4.61% | |
| JD | 4.57% | |
| TGT | 1.71% | |
| TJX | 0.75% | |
| COST | -0.86% | |
| WMT | -5.36% | |
| HD | -14.01% | |
| DG | -15.01% | |
| LOW | -18.67% | |
| ULTA | -22.92% |
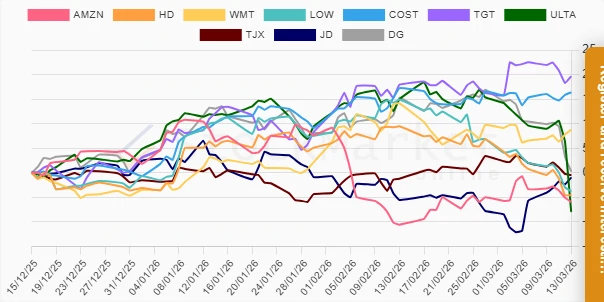
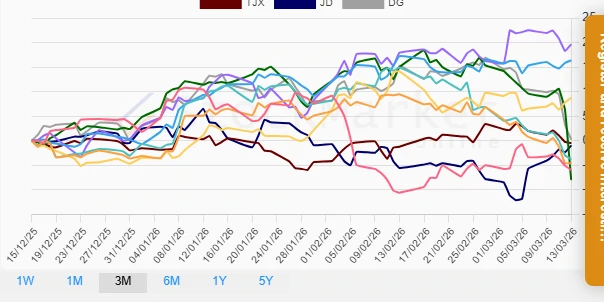
Retail Stocks Performance Three Months 📉
Over the three-month period, TGT and COST outperformed, whereas ULTA continued to underperform. This highlights a nuanced sector with both potential for growth and vulnerability to market pressures.
| Stock | Performance (%) | Performance |
|---|---|---|
| TGT | 19.64% | |
| COST | 16.37% | |
| WMT | 8.76% | |
| DG | 0.26% | |
| TJX | -0.47% | |
| JD | -0.99% | |
| LOW | -3.76% | |
| HD | -4.55% | |
| AMZN | -5.96% | |
| ULTA | -7.94% |
Summary 🗣️
The retail sector remains volatile, characterized by sharp contrasts between the best and worst performers. Factors such as consumer demand, supply chain issues, and competitive pressures influence stock performances. While opportunities exist for growth, especially in e-commerce and adaptability to market demands, vigilance is crucial for investors navigating this unpredictable landscape. Strategic diversification and keen observation of market trends are advisable.
Smart Data Insight
Master the Perfect Entry & Exit for this Stock
Don't leave your profits to chance. Historically, this stock follows specific seasonal patterns that institutional traders use to maximize returns.
- ✅ Identify the "Golden Buying Window"
- ✅ Avoid high-risk correction cycles
- ✅ Backtested data from the last 20+ years